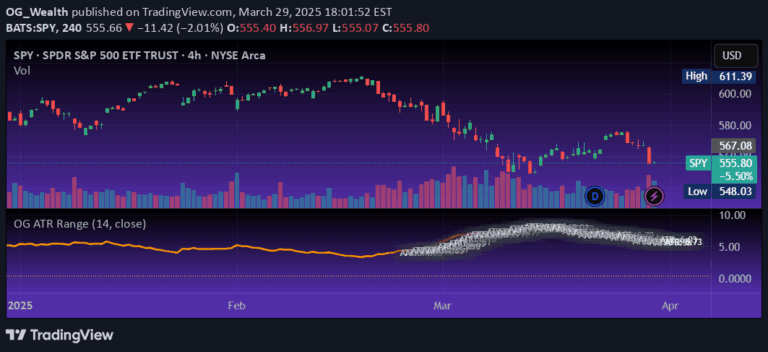
An ATR-based indicator that visualizes market volatility by plotting range levels above and below the previous close price, helping traders understand potential price movement zones.
Explore complementary indicator rolesHow it works
The DataDoodles ATR Range indicator calculates the Average True Range (ATR) based on the previous bar's close price, creating multiple volatility range levels. It generates three distinct ATR levels above and below the close price: 1ATR, 2ATR, and 3ATR, which represent potential price movement boundaries.
Additionally, the indicator applies an Exponential Moving Average (EMA) to the ATR values, creating a smoother representation of volatility trends. These ranges are color-coded and visually plotted on the chart, allowing traders to quickly interpret potential support and resistance levels based on recent market volatility.
Why it may be useful
Understanding market volatility is crucial for effective trading strategy development and risk management. This indicator provides traders with a visual representation of potential price movement ranges, helping them make more informed decisions about entry and exit points.
By displaying ATR levels and their corresponding EMA, traders can quickly assess market conditions, anticipate potential price fluctuations, and adjust their trading strategies accordingly. The color-coded ranges and customizable data table offer an intuitive way to analyze market volatility in real-time.
When to explore it
The DataDoodles ATR Range indicator is most effective during periods of changing market volatility, such as during economic announcements, earnings reports, or significant market events. Traders can use this tool to identify potential breakout levels, set stop-loss and take-profit targets, and understand the current market dynamics.
It is particularly useful for traders who want to adapt their strategies to current market conditions, as the indicator provides a clear visual representation of recent price movement ranges. Scalpers, day traders, and swing traders can benefit from its versatile volatility analysis across different timeframes and market instruments.
Keep exploring
What we’ve verified
Access, alerts and repainting behaviour have not been independently verified for this indicator. Check the creator’s current publication and settings.
General descriptions and classifications are recovered research. Verified details above identify the specific checks we have completed. Check the creator’s current publication for later changes.