
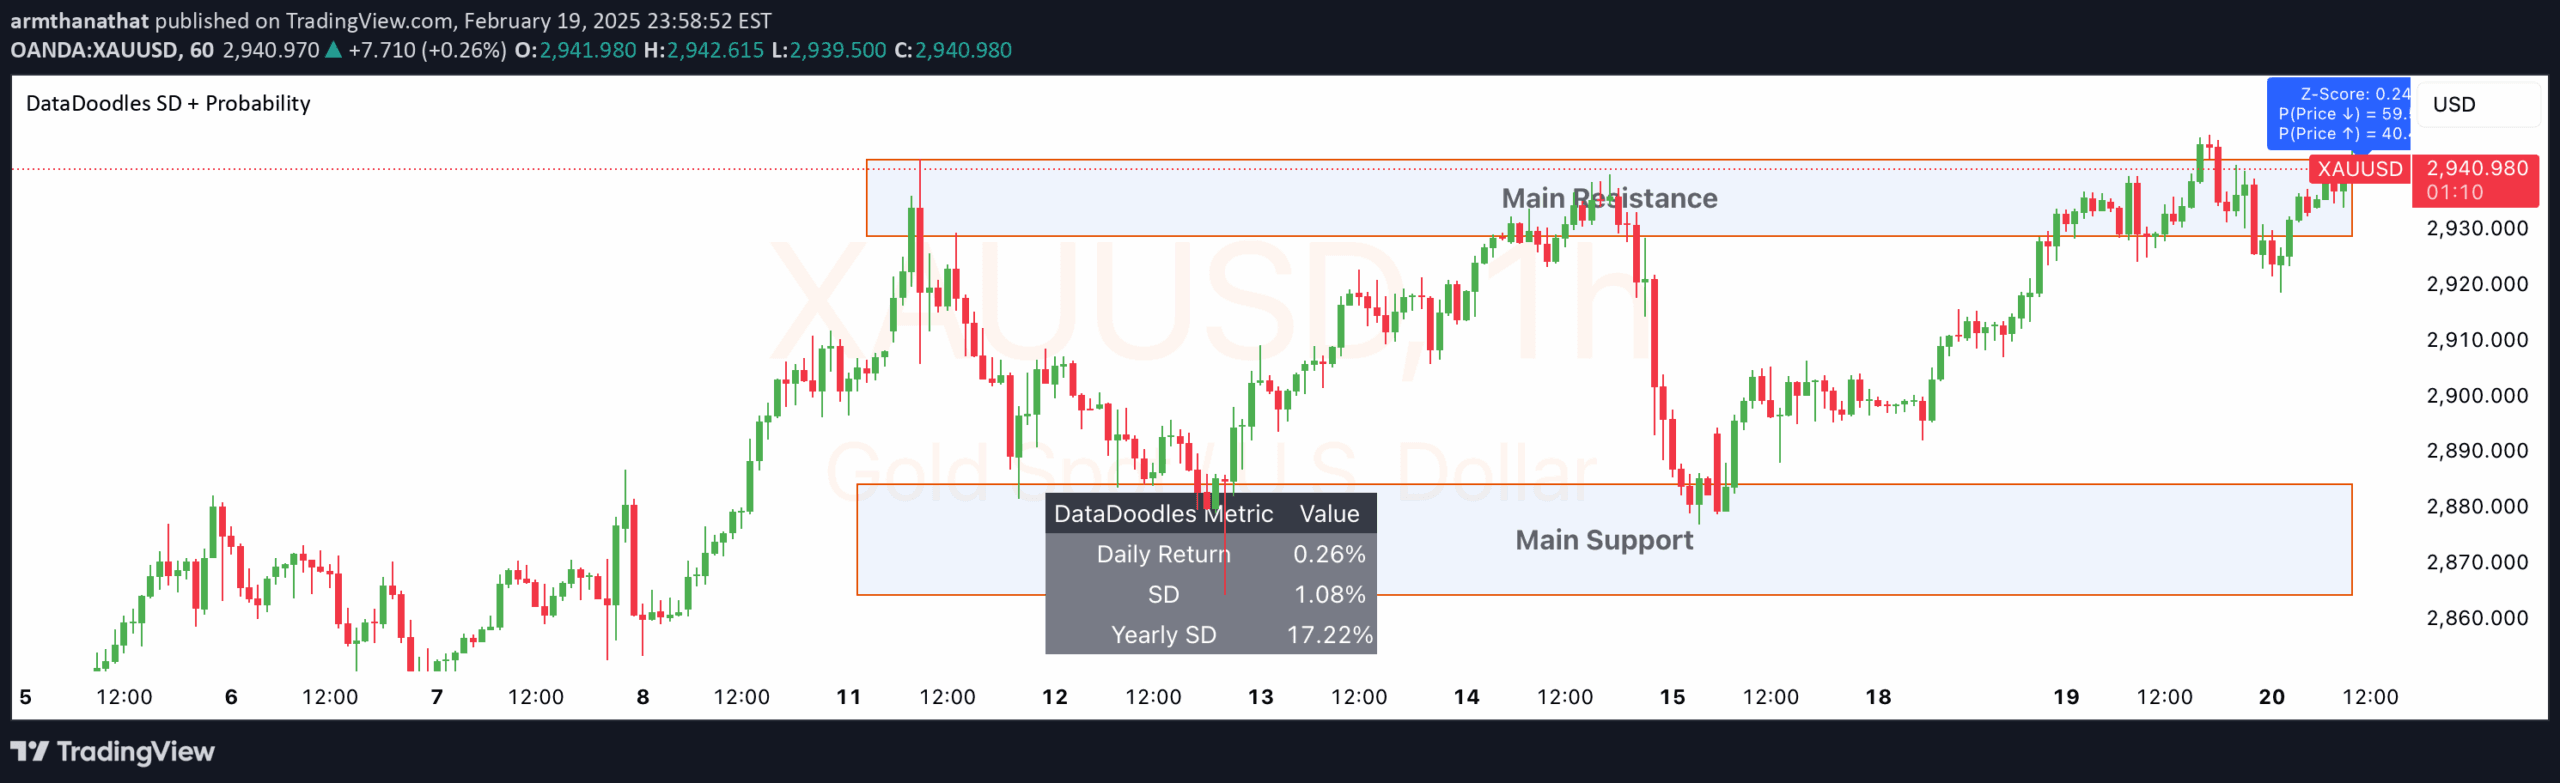
Advanced statistical indicator calculating annualized standard deviation and price movement probabilities to provide traders with quantitative market insights and dynamic trading alerts.
Explore complementary indicator rolesHow it works
The DataDoodles SD + Probability indicator calculates volatility by computing rolling standard deviation of daily returns using a user-defined period, typically 252 days. It annualizes the volatility to provide a comprehensive view of expected price fluctuations, enabling traders to understand potential market movements.
By employing a normal distribution cumulative distribution function, the indicator computes probabilities of upward and downward price movements, adjusting these probabilities based on a corrected Z-Score. It visually represents these insights by plotting projected high and low price levels, displaying Z-Score metrics, and generating a dynamic statistics table to help traders quickly interpret market conditions.
Why it may be useful
This indicator provides traders with a quantitative edge by transforming complex statistical calculations into actionable market insights. It bridges the gap between raw data and strategic decision-making, offering a systematic approach to understanding market volatility and potential price movements.
By presenting probability metrics, annualized volatility, and dynamic alerts, the indicator empowers traders to make more informed and precise trading decisions. It helps manage risk by providing clear visualizations of potential price ranges and high-probability market scenarios, thereby enhancing overall trading strategy and risk management capabilities.
When to explore it
The DataDoodles SD + Probability indicator is most effective in markets with consistent price data and relatively stable volatility patterns. It works best when traders want to gain a statistical understanding of potential price movements across different timeframes, from short-term scalping to longer-term swing trading strategies.
Traders should leverage this indicator during periods of market uncertainty, when traditional technical analysis might provide limited insights. It is particularly useful for developing a data-driven approach to trading, helping to identify high-probability trading opportunities and manage risk more effectively across various market conditions.
Keep exploring
What we’ve verified
Access, alerts and repainting behaviour have not been independently verified for this indicator. Check the creator’s current publication and settings.
General descriptions and classifications are recovered research. Verified details above identify the specific checks we have completed. Check the creator’s current publication for later changes.


