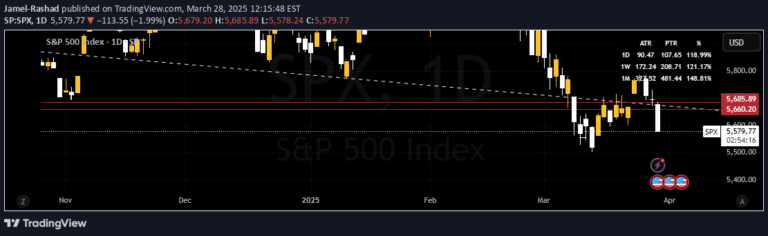
An ATR-based projection indicator that calculates potential high and low price levels by adding or subtracting the Average True Range (ATR) from current candle's high and low points.
Explore complementary indicator rolesHow it works
The ATR projection indicator calculates potential price levels by using the Average True Range. For the ATR High, the ATR value is added to the current candle's low. For the ATR Low, the ATR value is subtracted from the current candle's high.
The indicator typically uses a 20-day RMA (Rolling Moving Average) to compute the ATR. If price action exceeds either projection, the opposite ATR level is fixed to the period's extreme point, ensuring dynamic and adaptive projections based on current market volatility
Why it may be useful
This indicator helps traders understand potential price range and volatility by providing dynamic projection levels. By incorporating ATR, it offers insights into market volatility and potential price movement boundaries.
Traders can use these projections to set stop-loss levels, identify potential support and resistance zones, and make more informed trading decisions. The adaptive nature of the indicator allows for real-time assessment of market conditions and potential price expansion or contraction
When to explore it
The ATR projection indicator works best in markets with clear trending characteristics and moderate to high volatility. It is particularly useful during periods of market uncertainty, when traders need to assess potential price ranges.
Swing traders and day traders can benefit from this indicator when looking to establish trade entry and exit points. It is most effective in liquid markets with sufficient price movement, such as major forex pairs, stock indices, and commodities
Keep exploring
What we’ve verified
Access, alerts and repainting behaviour have not been independently verified for this indicator. Check the creator’s current publication and settings.
General descriptions and classifications are recovered research. Verified details above identify the specific checks we have completed. Check the creator’s current publication for later changes.