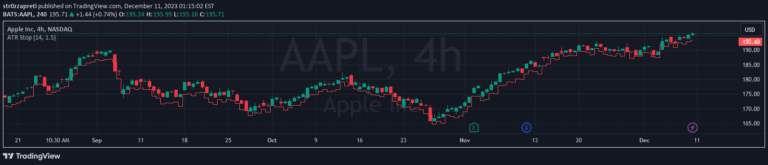
A trading indicator that predicts daily high and low prices using Average True Range (ATR), providing insights into market volatility and potential price ranges.
Explore complementary indicator rolesHow it works
The ATR Price Range Prediction script calculates the Average True Range over a specified period to estimate potential price movements. It determines the expected high price by adding the ATR value to the day's low price, and the expected low price by subtracting the ATR value from the day's high price.
The script tracks and updates the proportion of days where the daily price range meets or exceeds the ATR value. By color-coding bars and displaying a real-time table with expected price levels, traders can quickly visualize potential price targets and volatility conditions.
Why it may be useful
Understanding market volatility is crucial for effective trading strategy and risk management. This indicator provides traders with a dynamic view of potential price ranges, helping them set more informed stop-loss and take-profit levels based on recent market behavior.
By displaying the proportion of days with significant price movements, traders can assess market volatility trends and adapt their trading approach accordingly. The visual representation of expected high and low prices offers a quick and intuitive way to gauge potential market movements.
When to explore it
The ATR Price Range Prediction works best in markets with consistent volatility and clear directional trends. It is particularly useful for day traders and scalpers who need to make quick decisions based on short-term price movements and volatility assessments.
Traders should use this indicator in conjunction with other technical analysis tools to confirm signals and validate potential trade setups. It is most effective in liquid markets with sufficient trading volume and during periods of stable market conditions.
Keep exploring
What we’ve verified
Access, alerts and repainting behaviour have not been independently verified for this indicator. Check the creator’s current publication and settings.
General descriptions and classifications are recovered research. Verified details above identify the specific checks we have completed. Check the creator’s current publication for later changes.