
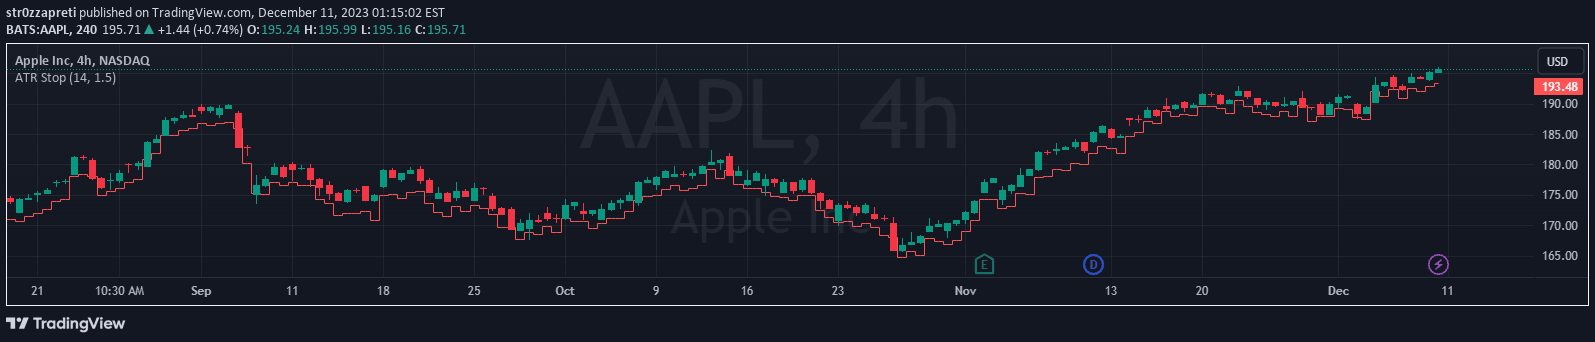
The ATR Stop indicator calculates separate Average True Range levels for profitable and unprofitable price movements, helping traders dynamically set stop levels based on market volatility.
Explore complementary indicator rolesHow it works
The ATR Stop indicator operates by separately calculating Average True Range for green (profitable) and red (unprofitable) price candles. By analyzing volatility independently for each candle type, it provides distinct ATR measurements that reflect different market behaviors.
Traders can adjust a dynamic multiplier to fine-tune the sensitivity of stop levels. The indicator then plots these ATR-based stop levels one candle ahead on the chart, offering visual guidance for potential exit points based on recent price movement characteristics.
Why it may be useful
The ATR Stop indicator provides traders with a sophisticated approach to setting stop levels that adapts to changing market conditions. By distinguishing between profitable and unprofitable price movements, it offers more nuanced risk management insights compared to traditional single-calculation ATR methods.
This approach allows traders to develop more responsive and context-aware trading strategies. The ability to customize ATR calculations and multipliers enables traders to align the indicator with their specific risk tolerance and trading style, making it a versatile tool for managing market uncertainty.
When to explore it
The ATR Stop indicator is most effective in markets with significant price volatility and clear trending characteristics. It works particularly well in markets where price movements exhibit distinct behavioral patterns between bullish and bearish candles.
Traders should consider using this indicator when they want a dynamic, adaptable approach to setting stop levels that goes beyond traditional fixed-point methods. It is especially useful in markets like cryptocurrencies, forex, and active stock indices where volatility can change rapidly and unpredictably.
Keep exploring
What we’ve verified
Access, alerts and repainting behaviour have not been independently verified for this indicator. Check the creator’s current publication and settings.
General descriptions and classifications are recovered research. Verified details above identify the specific checks we have completed. Check the creator’s current publication for later changes.


