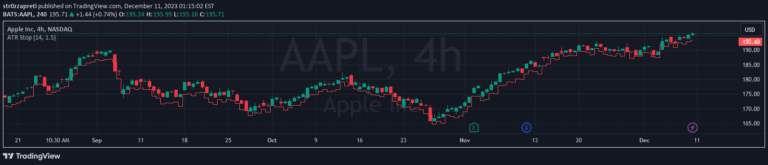
An advanced ATR indicator that offers customizable placement and color options for tracking stop losses. Provides flexible visualization of market volatility and potential trade exit points.
Explore complementary indicator rolesHow it works
The ATR (Average True Range) indicator calculates market volatility by measuring price range fluctuations over a specific period. It computes the average of true ranges, which represent the maximum of three price differences: current high to low, current high to previous close, and current low to previous close.
This customizable version allows traders to adjust the ATR calculation parameters and visual presentation, enabling more personalized volatility tracking. By plotting current ATR values alongside long and short stop losses, traders can dynamically adapt their risk management strategy based on real-time market conditions.
Why it may be useful
Understanding market volatility is crucial for managing trading risk and setting appropriate stop loss levels. The ATR indicator helps traders quantify price movement intensity, which is essential for determining position sizing and potential trade exit points.
By providing a flexible visualization of market volatility, this indicator empowers traders to make more informed decisions about trade entry and exit strategies. The customizable features allow for personalized analysis that can be tailored to individual trading styles and risk tolerances.
When to explore it
This ATR indicator is most effective during periods of significant market movement and when traders need precise volatility insights. It works particularly well in markets experiencing dynamic price changes, such as during economic announcements or sector-specific events.
Traders should leverage this tool when they require granular control over volatility visualization and stop loss management. It is especially useful for developing adaptive trading strategies that can quickly respond to changing market conditions across different timeframes and asset classes.
Keep exploring
What we’ve verified
Access, alerts and repainting behaviour have not been independently verified for this indicator. Check the creator’s current publication and settings.
General descriptions and classifications are recovered research. Verified details above identify the specific checks we have completed. Check the creator’s current publication for later changes.