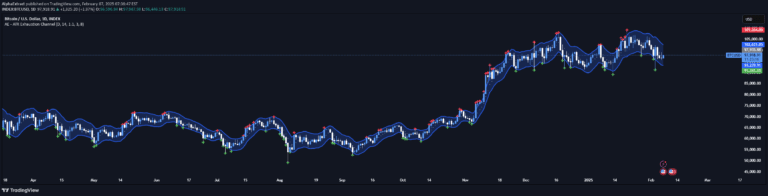
A dynamic indicator analyzing price deviations from a smoothed midline, providing traders with visual insights into market conditions through deviation levels and heat-colored candles.
Explore complementary indicator rolesHow it works
Dynamic Deviation Levels operates by calculating a smoothed midline representing the median price source. This central line serves as a reference point for tracking price movements and calculating deviation levels. The indicator plots three distinct deviation levels both above and below the midline, labeled from -3 to +3, which help traders understand the current market positioning.
The system also incorporates a unique heat-colored candle feature where candle colors change intensity based on the current deviation level. This visual representation allows traders to quickly interpret market conditions through gradient shades, with different intensities representing varying degrees of price movement from the midline.
Why it may be useful
Dynamic Deviation Levels provides traders with a comprehensive visual tool for understanding market dynamics and price momentum. By offering clear, labeled deviation levels, traders can quickly identify potential overbought or oversold conditions, which are critical for making informed trading decisions. The indicator transforms complex price data into an intuitive, easy-to-understand format that helps traders recognize market extremes.
The heat-colored candle system and interactive color scale add an additional layer of insight, enabling traders to interpret market conditions at a glance. These features help traders track trend reversals, understand price momentum, and make more strategic entry and exit decisions across different market conditions.
When to explore it
Dynamic Deviation Levels works best in markets with clear trending or ranging characteristics, where price movements can be effectively analyzed through deviation from a central line. Traders will find this indicator most useful in liquid markets with consistent price action, such as major forex pairs, stock indices, and prominent cryptocurrencies. The tool is particularly effective during periods of moderate to high volatility.
The indicator is especially valuable during market transitions, helping traders identify potential trend reversals or momentum shifts. It can be applied across multiple timeframes, making it versatile for scalpers, day traders, and swing traders. Traders should combine this indicator with other technical analysis tools to confirm signals and develop robust trading strategies.
Keep exploring
What we’ve verified
Access, alerts and repainting behaviour have not been independently verified for this indicator. Check the creator’s current publication and settings.
General descriptions and classifications are recovered research. Verified details above identify the specific checks we have completed. Check the creator’s current publication for later changes.