
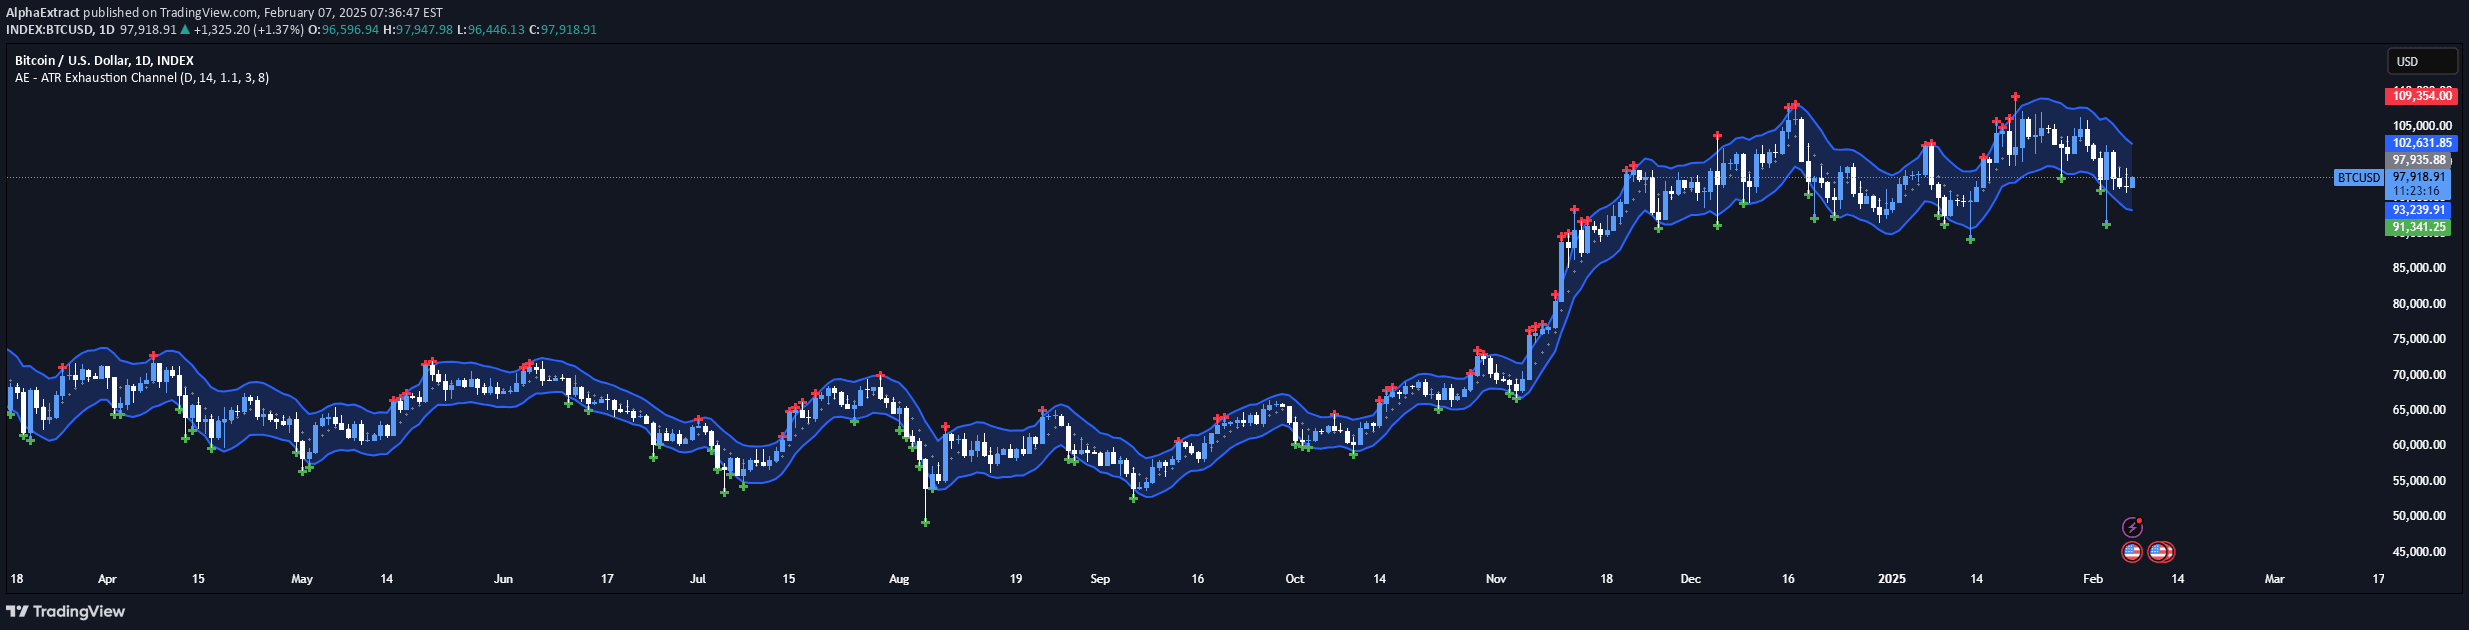
An ATR-based channel indicator that identifies trend exhaustion and potential breakouts by dynamically tracking price movements using volatility bands and an averaged SMA.
Explore complementary indicator rolesHow it works
The AE - ATR Exhaustion Channel first calculates an averaged Simple Moving Average (SMA) over a customizable period range to establish the core trend direction. It then constructs dynamic volatility bands using the Average True Range (ATR), which are added and subtracted from the SMA based on a multiplier setting.
The indicator plots red crosses when price exceeds the upper ATR band, signaling potential overextension, and green crosses when price drops below the lower band, indicating possible reversal zones. The area between the upper and lower bands is shaded blue, providing a visual representation of the trading range and volatility context.
Why it may be useful
Traders need precise tools to identify market exhaustion and potential trend reversals, and this indicator provides a comprehensive solution by combining trend and volatility analysis. The ATR-SMA hybrid approach allows for dynamic adaptation to changing market conditions, helping traders recognize when price movements might be losing momentum.
By offering clear visual markers and customizable settings, the indicator empowers traders to make more informed decisions about potential entry and exit points. The ability to adjust ATR sensitivity and SMA calculation periods makes this tool versatile across different market environments and trading styles.
When to explore it
The AE - ATR Exhaustion Channel is most effective in markets experiencing significant price movements and potential trend reversals. It works particularly well in trending markets where identifying exhaustion points can provide critical insights into potential trade opportunities. Traders can leverage this indicator to spot momentum shifts and validate potential entry or exit points.
The indicator is especially useful during periods of market volatility, such as during economic announcements, earnings reports, or significant news events. By tracking price movements relative to adaptive volatility bands, traders can gain a more nuanced understanding of market dynamics and potential trend continuation or reversal scenarios.
Keep exploring
What we’ve verified
Access, alerts and repainting behaviour have not been independently verified for this indicator. Check the creator’s current publication and settings.
General descriptions and classifications are recovered research. Verified details above identify the specific checks we have completed. Check the creator’s current publication for later changes.


