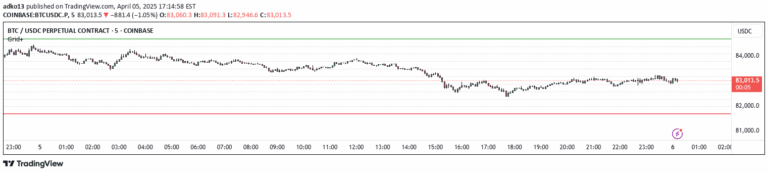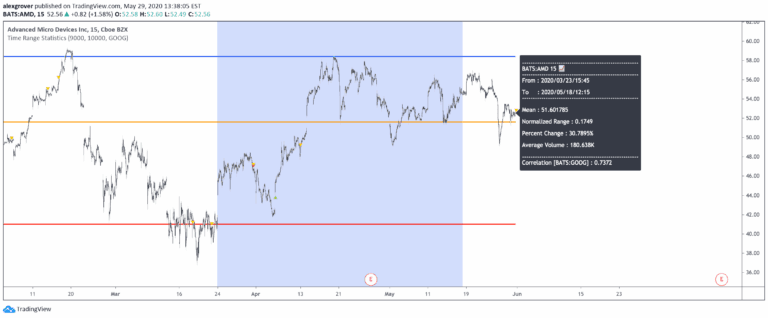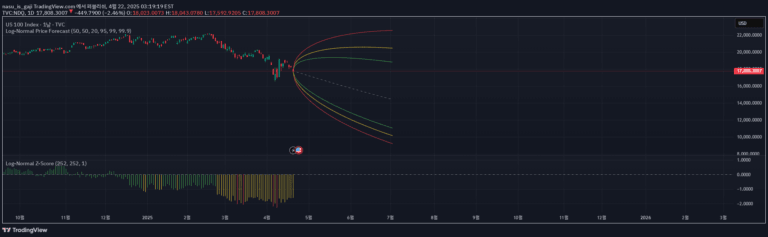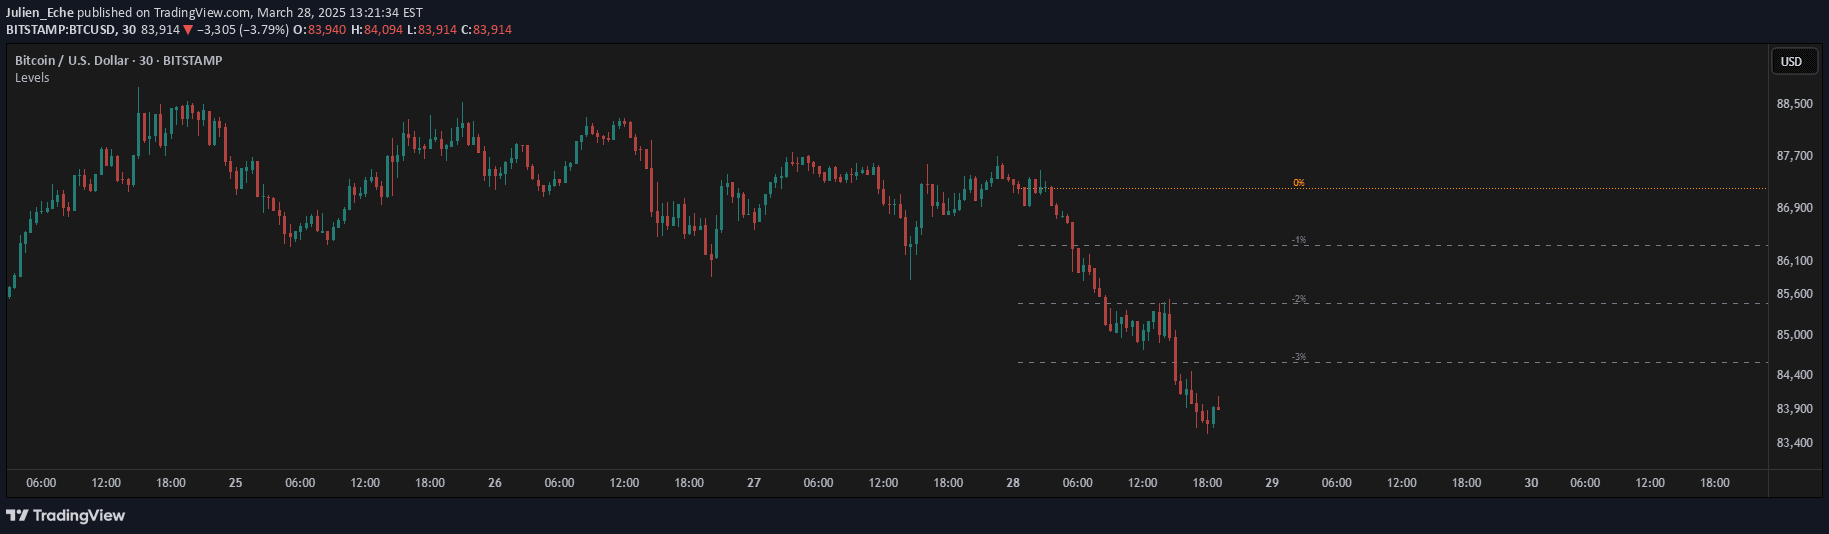
Smart % Levels is a dynamic indicator that visualizes significant percentage price movements by plotting clean, relevant horizontal levels based on the previous day's close or open.
Explore complementary indicator rolesHow it works
The indicator calculates percentage levels from the previous day's close or open price. Users can customize the percentage spacing between levels, such as 1% or 0.5%. The script dynamically filters and displays only the levels between yesterday's price and today's current price.
It automatically recalculates levels each market open to maintain accuracy. The tool allows customization of colors, line styles, widths, and opacity. It avoids repainting by plotting levels only based on available historical data
Why it may be useful
This indicator provides traders with a quick and clean visualization of price movements relative to meaningful thresholds. By showing only relevant levels, it reduces chart clutter and helps traders quickly understand the magnitude of price changes.
The dynamic filtering allows for rapid identification of significant price zones without overwhelming the chart with unnecessary lines. It offers a streamlined approach to intraday analysis, helping traders make more informed decisions based on percentage movements
When to explore it
Smart % Levels is most effective for day traders and scalpers who need rapid insights into price movements. It works best in volatile markets where quick percentage changes are crucial. Traders can use it to identify key support and resistance levels based on percentage moves.
It's particularly useful during high-volatility trading sessions or when tracking stocks with significant intraday price fluctuations. The indicator helps traders set quick entry and exit points based on percentage thresholds
Keep exploring
What we’ve verified
Access, alerts and repainting behaviour have not been independently verified for this indicator. Check the creator’s current publication and settings.
General descriptions and classifications are recovered research. Verified details above identify the specific checks we have completed. Check the creator’s current publication for later changes.