
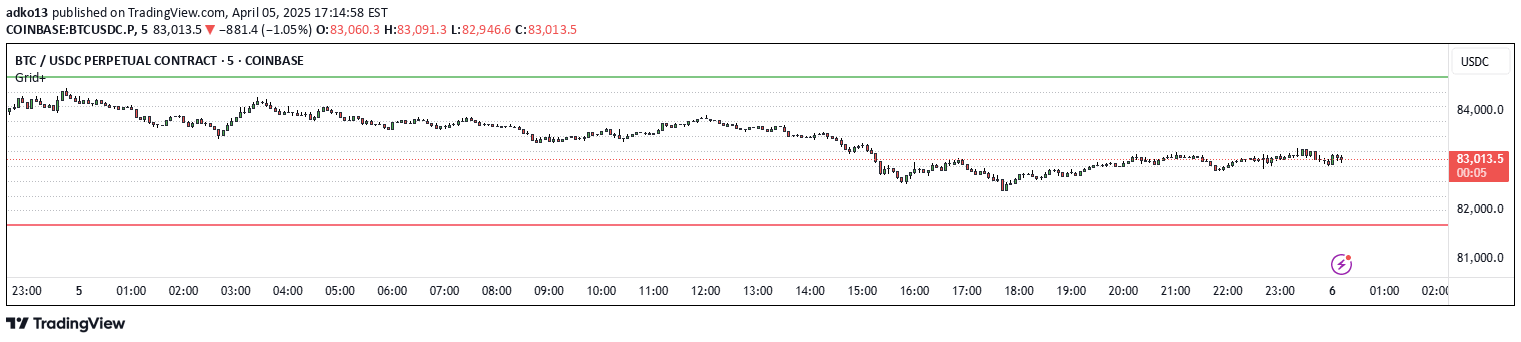
A flexible grid-based indicator that creates customizable horizontal price levels to help traders visualize potential support and resistance zones across different market conditions.
Explore complementary indicator rolesHow it works
The Improved Grid Level Visualizer generates horizontal lines across a specified price range by mathematically dividing the upper and lower price bounds into equal segments. Users can interactively adjust the bounds by dragging lines on the chart or setting precise numeric values.
The indicator calculates grid levels dynamically, automatically extending lines to the right margin of the chart. Grid line appearance can be customized with different colors, styles, and widths to suit individual trading preferences
Why it may be useful
This indicator provides traders with a powerful visual tool for understanding price dynamics and potential support/resistance levels.
By creating a structured grid, traders can more easily identify key price zones, manage grid trading strategies, and develop more systematic entry and exit points. The interactive and customizable nature of the grid allows for flexible analysis across different market conditions and trading styles
When to explore it
The grid level visualizer works best in markets with clear price ranges and potentially ranging or consolidating conditions. It is particularly useful for traders who employ grid trading strategies, want to identify potential support and resistance levels, or need a systematic approach to segmenting price action.
Traders can benefit from this tool when analyzing markets with predictable price movements or when seeking to establish structured trading parameters
Keep exploring
What we’ve verified
Access, alerts and repainting behaviour have not been independently verified for this indicator. Check the creator’s current publication and settings.
General descriptions and classifications are recovered research. Verified details above identify the specific checks we have completed. Check the creator’s current publication for later changes.


