
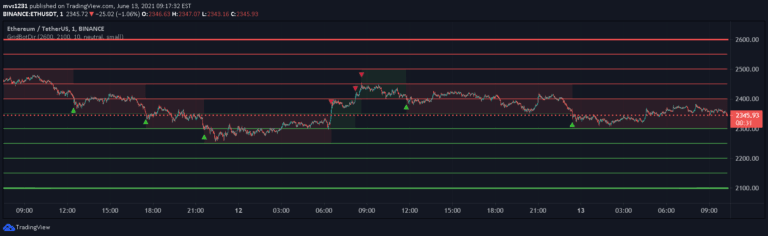
Grid Bot Simulator
A grid trading bot simulator that divides price ranges into zones, generating trading signals based on price movement in ranging and trending markets with customizable grid settings.
Explore 11,183 indicators. Filter beyond the obvious.
Discover the tools that fit the way you trade.
11,183 tools to explore
A grid trading bot simulator that divides price ranges into zones, generating trading signals based on price movement in ranging and trending markets with customizable grid settings.
An advanced liquidity heatmap that accumulates and tracks resting liquidity levels over time, revealing potential high-impact price zones by aggregating volume across multiple price levels.
A trading signal using Kadane's algorithm to identify the largest market impulse within a window, then applying Murrey's math lines to map potential price movements and trading opportunities.
The Gann Box is a technical analysis tool that uses geometric principles to identify potential support and resistance levels, forecast price movements, and analyze market trends.
A market analysis tool that identifies market structure, grid levels, and volume distribution to help traders visualize trading activity and measure price movements across different ranges.
A technical analysis tool based on W.D. Gann's Square of 144, helping traders identify potential price targets, support, and resistance levels through geometric price and time calculations.
A probabilistic grid tool that visualizes potential price reversal locations using a 10x10 matrix, helping traders understand the likelihood of future market movements.
A volume profile matrix indicator that calculates trading activity across a grid of intervals, revealing liquidity and high-volume price levels using color-coded cells.
A grid trading strategy using martingale position sizing that doubles position size after losses, aiming to recover from previous trades by increasing exposure with each unsuccessful trade.
A script for quickly analyzing trading signals by computing performance metrics across different stop-loss and take-profit configurations using SuperTrend signals.
A volume profile indicator that analyzes volume distribution across price levels by breaking down price ranges into grids and proportionally attributing volume from lower timeframes.
A visual time-tracking tool that plots vertical lines marking trading weeks and days to help traders maintain a clearer perspective on time-related aspects across different chart timeframes.
Likes, views, and comments are historical TradingView snapshots. They describe attention, not trading performance.