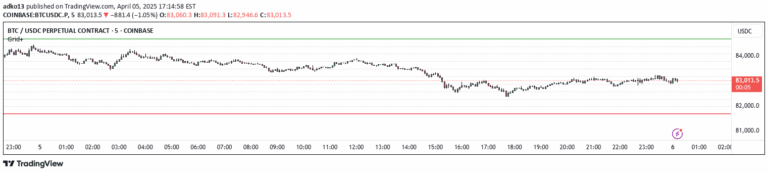
A volume profile indicator that analyzes volume distribution across price levels by breaking down price ranges into grids and proportionally attributing volume from lower timeframes.
Explore complementary indicator rolesHow it works
The volume profile indicator creates a precise volume analysis by dividing the price range into 100 equal grids. It drops down to a lower timeframe, approximately 16 times smaller than the current chart, and parses through each bar to attribute volume proportionally across the relevant grids. This means that if a lower timeframe bar touches multiple grids, the volume is distributed based on the percentage of the candle within each grid.
The script uses a quadratic time complexity algorithm to parse and attribute volume, which allows for comprehensive yet efficient volume distribution analysis. By limiting user inputs and implementing careful testing, the indicator provides a robust method of understanding volume concentration across different price levels.
Why it may be useful
Volume profile analysis helps traders understand market dynamics by revealing where the most trading activity has occurred within a specific price range. By identifying high-volume areas, traders can gain insights into potential support and resistance levels, market sentiment, and potential future price movements. This information is crucial for making more informed trading decisions.
The proportional volume attribution method provides a more nuanced view of volume distribution compared to traditional volume indicators. Traders can use this detailed analysis to identify key market characteristics such as balanced versus imbalanced markets, trend strength, and potential entry and exit points based on historical volume concentration.
When to explore it
The volume profile indicator is most effective in markets with clear and consistent trading volume, such as major currency pairs, popular stock indices, and liquid commodities. It works best when applied to timeframes that provide sufficient trading data to create meaningful volume distributions. Traders should use this indicator when they want to gain deeper insights into market structure and volume dynamics.
The indicator is particularly useful during trending markets, consolidation periods, and when analyzing potential breakout or reversal scenarios. Traders can leverage the volume profile to identify high-probability trade setups, determine logical stop-loss and take-profit levels, and assess the overall strength and character of market movements across different timeframes.
Keep exploring
What we’ve verified
Access, alerts and repainting behaviour have not been independently verified for this indicator. Check the creator’s current publication and settings.
General descriptions and classifications are recovered research. Verified details above identify the specific checks we have completed. Check the creator’s current publication for later changes.