A volume profile indicator that identifies accumulation zones by analyzing volume patterns and Point of Control (POC) across different timeframes to detect potential trend reversals and trading opportunities.
Explore complementary indicator rolesHow it works
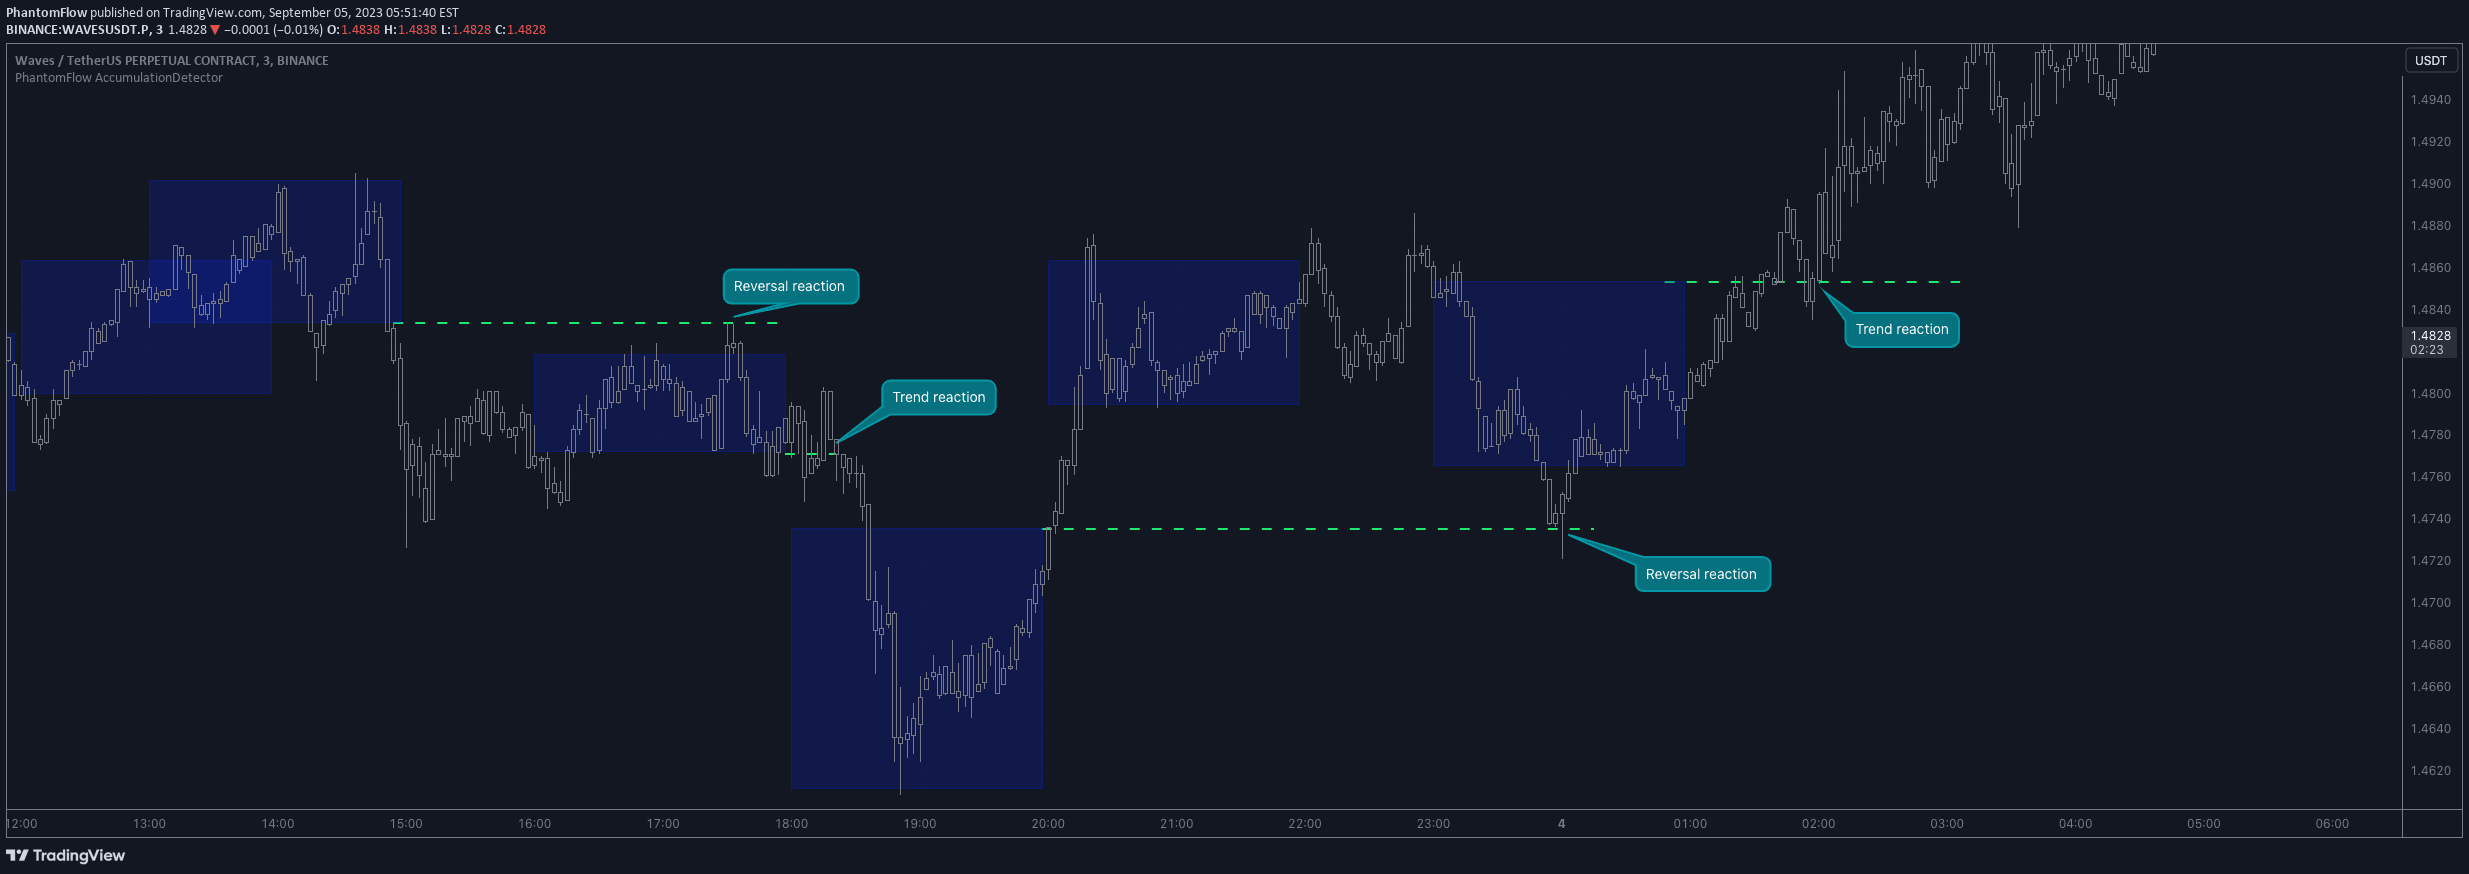
The PhantomFlow AccumulationDetector works by analyzing the volume profile of different timeframes to identify potential accumulation zones. It calculates the Point of Control (POC) and compares it with the Volume Area range of the previous period to determine significant trading zones.
The indicator uses complex volume profile calculations to detect areas where significant trading activity has occurred. By examining the relationship between current and previous volume zones, it can highlight potential areas of market interest and potential price movement.
Why it may be useful
Volume profile analysis provides traders with critical insights into market dynamics by revealing where most trading activity has concentrated. This approach helps traders understand potential support and resistance levels beyond traditional price-based methods.
By identifying accumulation zones, traders can make more informed decisions about entry and exit points. The indicator helps reveal market sentiment, potential trend reversals, and areas of significant trading interest that might not be apparent through standard price charts.
When to explore it
The PhantomFlow AccumulationDetector is most effective in markets with consistent volume and clear trading ranges. Traders should visually confirm the indicator's signals and avoid using it during periods of extreme market volatility.
It works best when applied to timeframes that match the trader's strategy, with careful attention to zone size and placement. Consecutive zones within the same range can be particularly powerful signals for potential market reversals or significant price movements.
Keep exploring
What we’ve verified
Access, alerts and repainting behaviour have not been independently verified for this indicator. Check the creator’s current publication and settings.
General descriptions and classifications are recovered research. Verified details above identify the specific checks we have completed. Check the creator’s current publication for later changes.