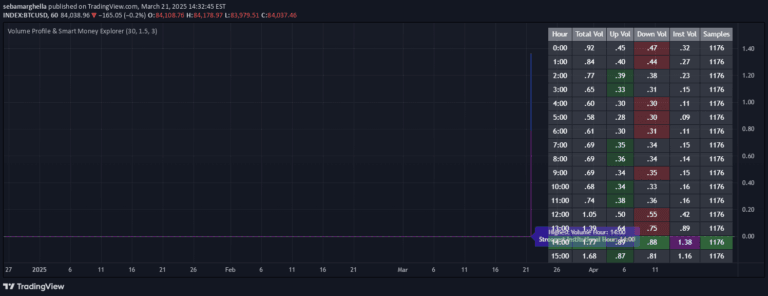
A precision trading panel that combines relative volume analysis, dynamic volume coloring, and VWAP bands to help traders identify liquidity events and potential market movements quickly.
Explore complementary indicator rolesHow it works
The Liquidity Volume Panel functions by first calculating the relative volume (RVOL) against a 20-period average to benchmark current trading activity. It then applies color-coded logic to visualize volume intensity, highlighting normal, strong, and extremely high volume levels.
The panel incorporates VWAP with standard deviation bands to show volume-weighted pricing and potential support/resistance zones. Volume spikes exceeding 200% of the average are automatically marked, providing visual alerts for significant market activity. Background highlighting further emphasizes extreme volume levels, making liquidity clusters instantly recognizable to traders
Why it may be useful
This panel is crucial for traders seeking to understand market dynamics through volume analysis. By providing a comprehensive view of trading activity, it helps identify potential trend reversals, breakout opportunities, and liquidity events. The relative volume indicator allows traders to quickly assess whether current market conditions are typical or unusual.
Standard deviation bands offer insights into potential overbought or oversold conditions based on volume-weighted pricing. The visual cues and color-coding make complex volume data more accessible and interpretable for traders of all skill levels
When to explore it
The Liquidity Volume Panel is most effective in fast-moving, high-volatility markets where volume provides critical trading signals. It is particularly useful for scalpers and intraday traders operating on lower timeframes who need rapid, precision-based decision-making tools.
Traders should apply this panel during market open, major economic announcements, and periods of potential trend transitions. It works best when combined with other technical analysis tools to confirm signals. Cryptocurrency, forex, and active stock markets are ideal environments for leveraging this volume-based analytical approach
Keep exploring
What we’ve verified
Access, alerts and repainting behaviour have not been independently verified for this indicator. Check the creator’s current publication and settings.
General descriptions and classifications are recovered research. Verified details above identify the specific checks we have completed. Check the creator’s current publication for later changes.