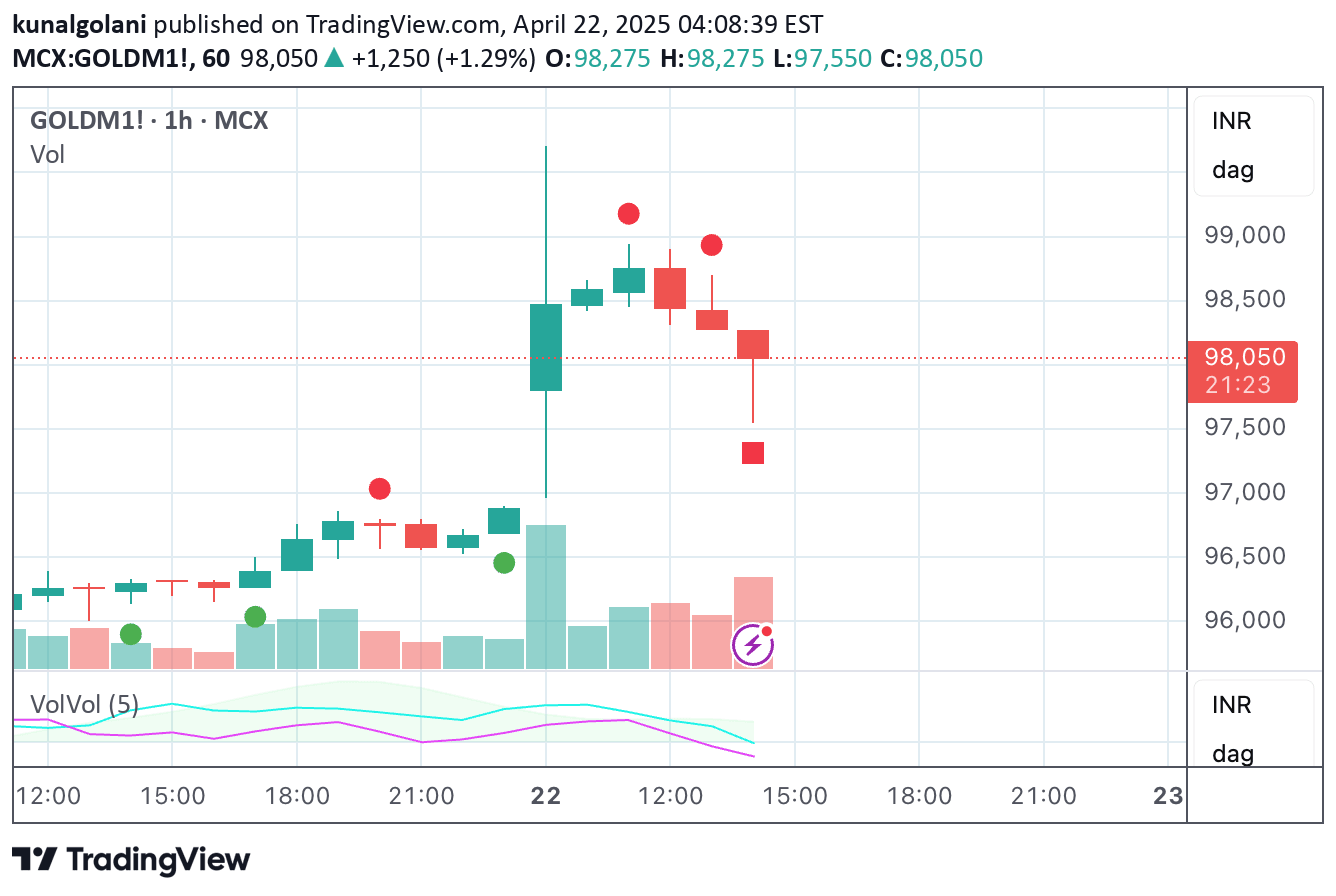
A dynamic volume-based indicator that analyzes price ranges and trading volume to provide insights into market momentum and potential trend reversals across different timeframes.
Explore complementary indicator rolesHow it works
The Entoryx Volume indicator calculates a delta between the highest high and lowest low over a specified number of bars, creating a dynamic line that represents market momentum. It uses an Exponential Moving Average (EMA) of closing prices as a baseline to determine bullish or bearish conditions, with the line changing color accordingly.
The indicator plots a current value line that fluctuates above and below a zero line, with color-coded regions providing visual representation of market sentiment. Additional features include optional order block bar detection and horizontal boundary lines at +10 and -10 to highlight significant market movements.
Why it may be useful
The Entoryx Volume indicator offers traders a comprehensive view of market dynamics by integrating volume analysis with price range movements. Its color-coded display allows quick interpretation of market sentiment, helping traders identify potential trend shifts and momentum changes with visual clarity.
By providing both numerical and color-based insights, the indicator reduces the complexity of market analysis and enables traders to make more informed decisions. The flexibility of optional features and customization options makes it adaptable to various trading styles and personal preferences.
When to explore it
The Entoryx Volume indicator is most effective in markets with clear trending conditions and significant volume activity. It performs well in liquid markets such as major stock indices, forex pairs, and high-volume commodities where price movements are more predictable and volume trends are consistent.
Traders should use this indicator in conjunction with other technical analysis tools to confirm signals and validate potential trade entry or exit points. It is particularly useful during periods of market transition, helping identify potential trend reversals and momentum shifts across different timeframes.
Keep exploring
What we’ve verified
Access, alerts and repainting behaviour have not been independently verified for this indicator. Check the creator’s current publication and settings.
General descriptions and classifications are recovered research. Verified details above identify the specific checks we have completed. Check the creator’s current publication for later changes.