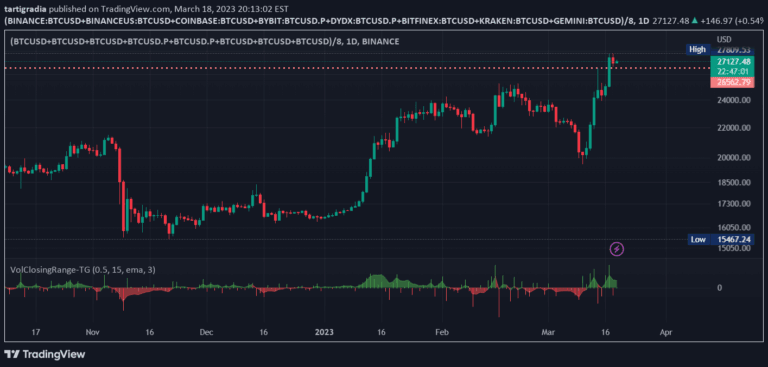
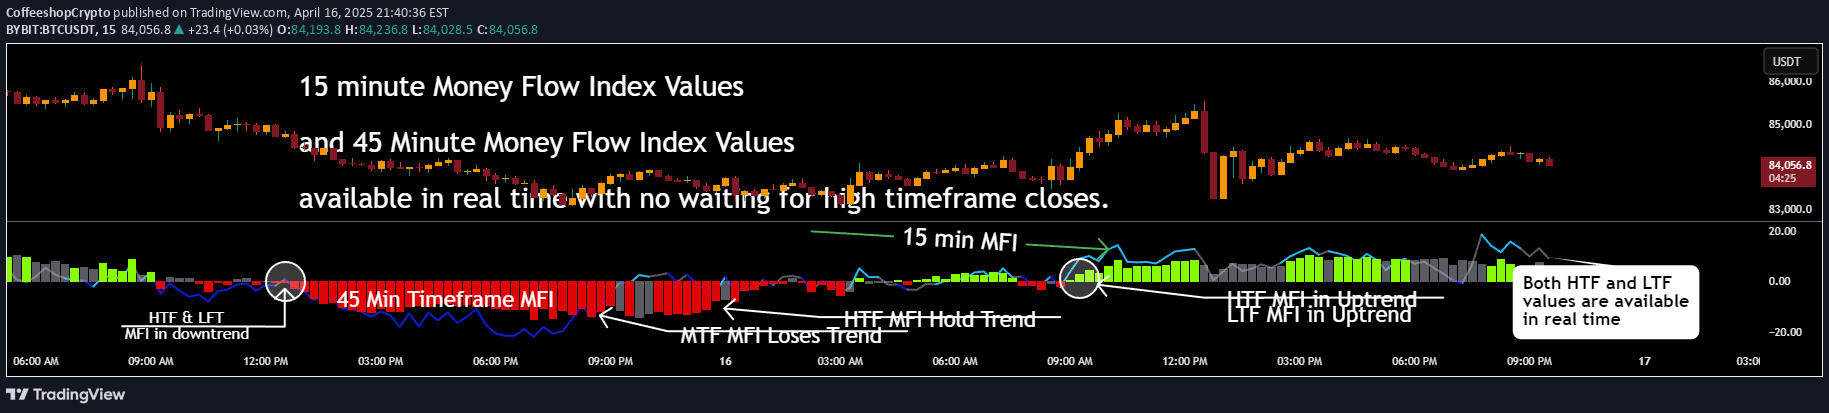
The Volume Weighted Sign Change Index (VWSCI) analyzes the relationship between price reversals and trading volume, revealing market dynamics through volume concentration at price turning points.
Explore complementary indicator rolesHow it works
The VWSCI calculates the proportion of total volume occurring at price reversal points within a specific time window. It identifies bars where the price direction changes, measuring the volume associated with these turning points. By tracking where significant volume clusters during price sign changes, the indicator provides insight into market momentum and potential trend shifts.
The calculation involves tracking volume at points where price transitions from positive to negative or vice versa, effectively mapping volume concentration during key market inflection points. This approach allows traders to distinguish between strong trending markets with consistent directional movement and ranging markets characterized by frequent price reversals.
Why it may be useful
The VWSCI offers traders a unique perspective on market dynamics by combining volume and price action analysis. It helps distinguish between trending and ranging market conditions, providing valuable insights into potential market sentiment and momentum. By revealing how volume correlates with price reversals, traders can make more informed decisions about market direction and potential trend strength.
Traditional volume indicators often lack the nuanced insight that the VWSCI provides. Its ability to highlight volume concentration at price turning points gives traders a sophisticated tool for understanding market psychology and potential trend changes, making it a powerful complement to other technical analysis methods.
When to explore it
The VWSCI is most effective in markets with clear volume patterns and distinct price movements. It works exceptionally well in identifying potential trend reversals, especially in markets that show significant volume shifts during key price turning points. Traders can use this indicator to confirm momentum, detect potential trend exhaustion, and understand underlying market dynamics.
The indicator is particularly useful in volatile markets where volume plays a crucial role in determining market direction. It can be applied across various timeframes, from short-term scalping to longer-term swing trading, making it a versatile tool for traders seeking a comprehensive understanding of market volume and price interactions.
Keep exploring
What we’ve verified
Access, alerts and repainting behaviour have not been independently verified for this indicator. Check the creator’s current publication and settings.
General descriptions and classifications are recovered research. Verified details above identify the specific checks we have completed. Check the creator’s current publication for later changes.