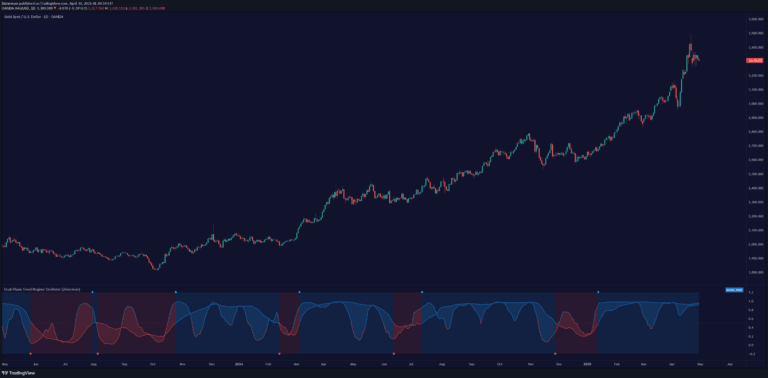
A volume-price intensity analyzer that combines trading value analysis with trend-following tools to measure market activity, identify momentum, and highlight significant price movements.
Explore complementary indicator rolesHow it works
The VolumePrice Intensity Analyzer calculates trading value by multiplying price and volume, then scaling to millions. It generates two Simple Moving Averages (SMAs) of 20 and 50 days to smooth out trading value fluctuations and reveal underlying trends.
The indicator plots daily trading value columns in color-coded bars, uses trend lines to show short and long-term movements, and creates a separate ratio plot comparing daily trading value to the longer-term SMA. This multi-layered approach provides a comprehensive view of market activity and potential momentum shifts.
Why it may be useful
Traditional volume indicators often provide limited insights, but this tool offers a more nuanced analysis of market dynamics by integrating price, volume, and trend information. It helps traders understand not just how much trading is happening, but the intensity and potential significance of market movements.
By combining multiple analytical techniques, the VolumePrice Intensity Analyzer provides traders with a holistic view of market activity. The real-time metrics, visual cues, and customizable settings make it easier to spot emerging trends, assess market strength, and make more informed trading decisions across different markets and timeframes.
When to explore it
The VolumePrice Intensity Analyzer is most effective during periods of significant market activity or potential trend changes. Traders should pay close attention when daily trading value columns exceed the SMAs or when the ratio plot shows unusual spikes in market intensity.
This indicator is particularly useful for identifying potential momentum shifts, confirming trend strength, and highlighting periods of unusual market activity. It works well across various markets including stocks, forex, and cryptocurrencies, and can be adapted to different trading styles and timeframes by adjusting its input parameters.
Keep exploring
What we’ve verified
Access, alerts and repainting behaviour have not been independently verified for this indicator. Check the creator’s current publication and settings.
General descriptions and classifications are recovered research. Verified details above identify the specific checks we have completed. Check the creator’s current publication for later changes.