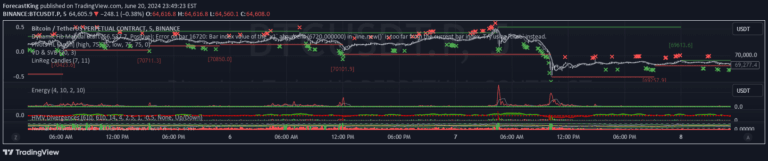
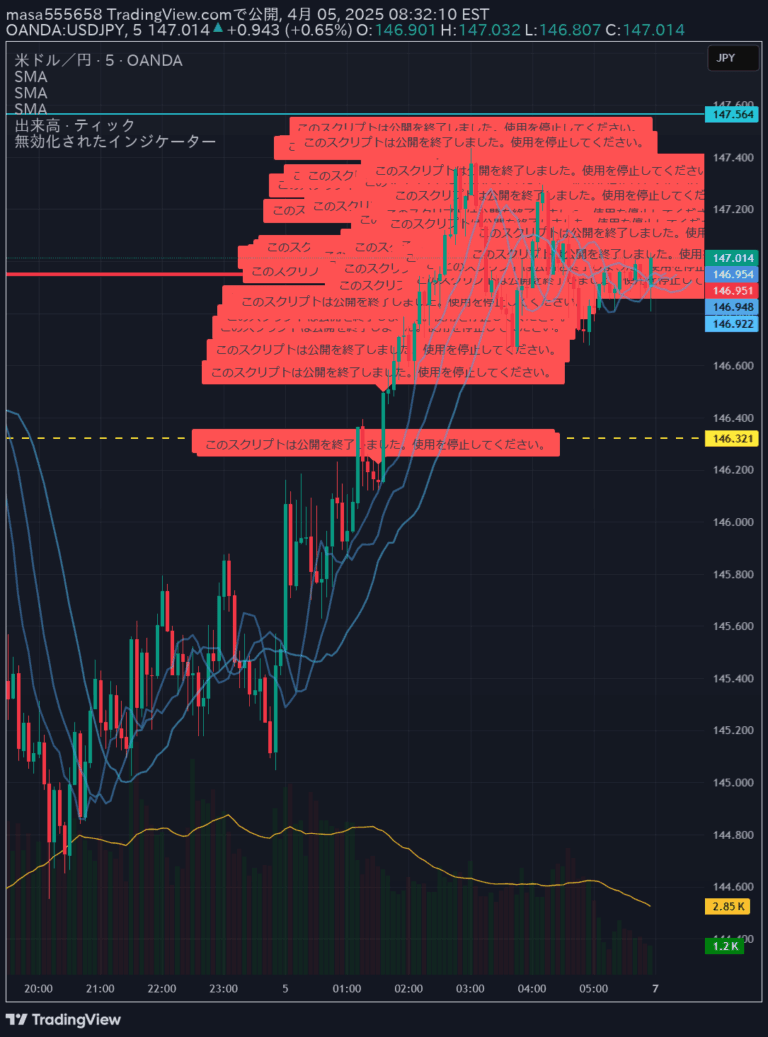
A volume-weighted indicator that measures closing range of price bars, revealing buying and selling pressure through color-coded bar analysis and moving average trend visualization.
Explore complementary indicator rolesHow it works
The indicator calculates a closing range by measuring the distance between a bar's high, low, and close prices, expressing this as a percentage from 0% to 100%. It then multiplies this percentage by the trading volume, creating a weighted representation of price action that emphasizes high-volume bars.
A moving average is applied to this volume-weighted closing range, which helps traders visualize trend momentum over multiple time periods. By default, closes above 50% are considered bullish, though this threshold can be customized, allowing traders to adjust sensitivity based on their specific trading strategy and market conditions.
Why it may be useful
This signal provides traders with a nuanced view of market sentiment by combining price positioning and trading volume into a single, easy-to-interpret metric. It reveals not just price movement, but the underlying strength and conviction behind each price bar, helping traders understand whether buying or selling pressure is dominant.
By weighting the closing range with volume, the indicator offers deeper insights than traditional price-only analysis. Traders can quickly identify potential trend reversals, gauge market momentum, and detect potential overreaction or exhaustion in price movements across various timeframes.
When to explore it
The indicator works best in markets with consistent trading volume and clear directional movements, such as stocks, futures, and forex. It is particularly effective during trending market conditions where volume can confirm the strength of price movements and potential continuation or reversal signals.
Traders should use this indicator in conjunction with other technical analysis tools to validate signals and reduce false positives. It is especially useful for identifying potential entry and exit points, understanding market sentiment, and detecting potential trend changes across different timeframes from short-term scalping to longer-term swing trading strategies.
Keep exploring
What we’ve verified
Access, alerts and repainting behaviour have not been independently verified for this indicator. Check the creator’s current publication and settings.
General descriptions and classifications are recovered research. Verified details above identify the specific checks we have completed. Check the creator’s current publication for later changes.