
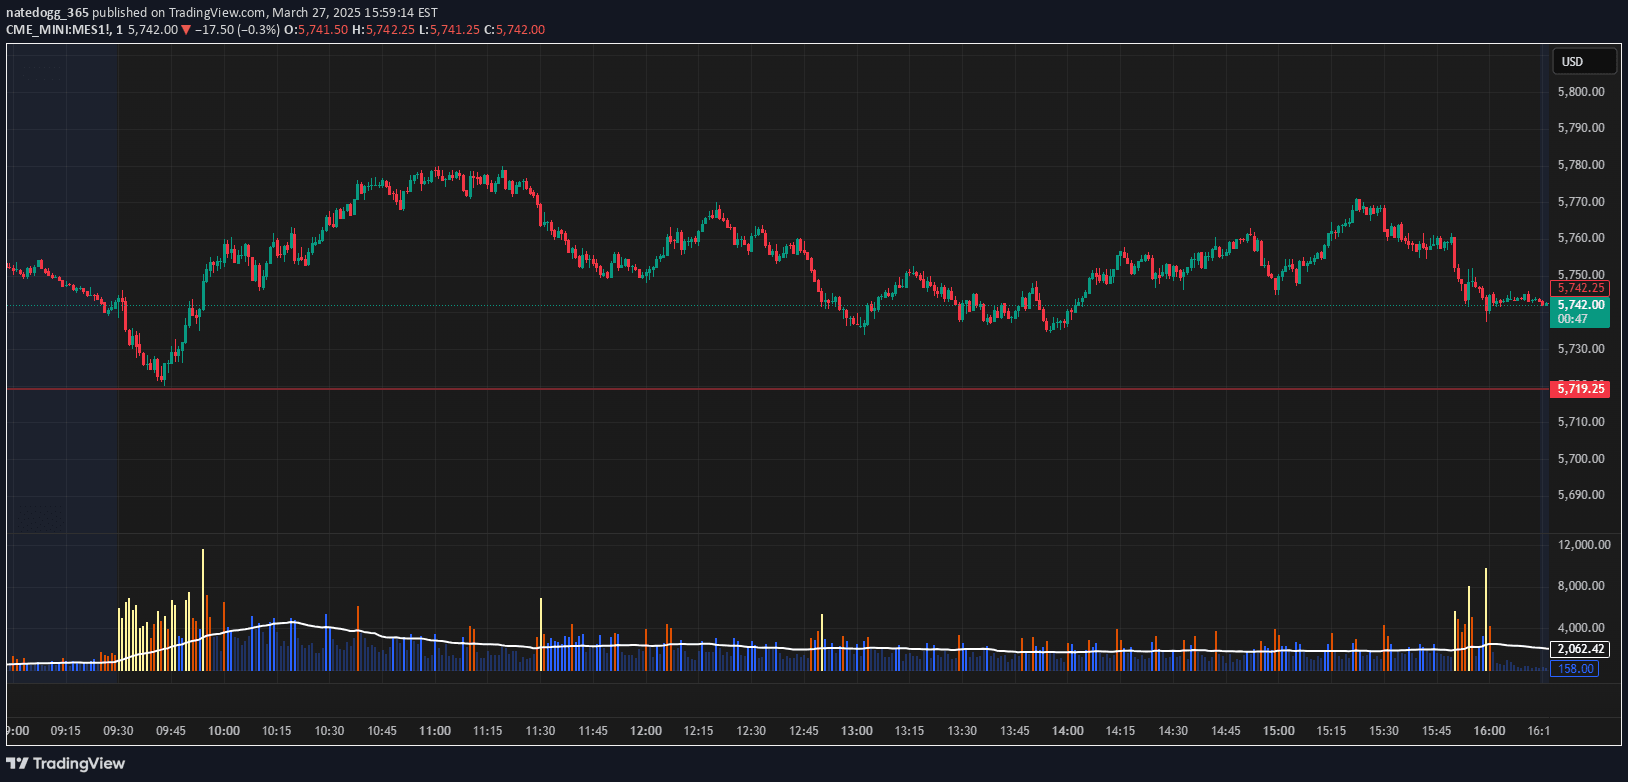
A volume histogram indicator that color-codes volume bars based on customizable thresholds, helping traders quickly identify potential breakouts and breakdowns by comparing current volume against historical averages.
Explore complementary indicator rolesHow it works
This volume indicator calculates a simple moving average (SMA) of volume using a user-defined lookback period. It then compares current volume against this average, creating color-coded bars to represent volume intensity.
Gray bars indicate low volume, blue represents normal activity, green signifies above-average volume suggesting potential breakouts, and red highlights extremely high volume indicating strong market moves. An orange reference line represents the calculated average volume for easy visual comparison
Why it may be useful
Volume analysis is crucial for confirming price movements and understanding market sentiment. By providing a visual representation of volume intensity, traders can quickly assess market participation and potential trend strength.
The color-coded system allows rapid identification of significant volume shifts, which often precede important price changes. This helps traders validate breakouts, anticipate potential trend reversals, and make more informed trading decisions based on volume dynamics
When to explore it
This indicator works best in markets with moderate to high liquidity where volume data is meaningful. It is particularly useful during potential breakout scenarios, trend reversals, and periods of significant market movement.
Traders can customize thresholds to suit different market conditions, making it adaptable for various assets and trading styles. Short-term traders can benefit from quicker volume signals, while longer-term traders can use broader volume averages to identify sustained market trends
Keep exploring
What we’ve verified
Access, alerts and repainting behaviour have not been independently verified for this indicator. Check the creator’s current publication and settings.
General descriptions and classifications are recovered research. Verified details above identify the specific checks we have completed. Check the creator’s current publication for later changes.


