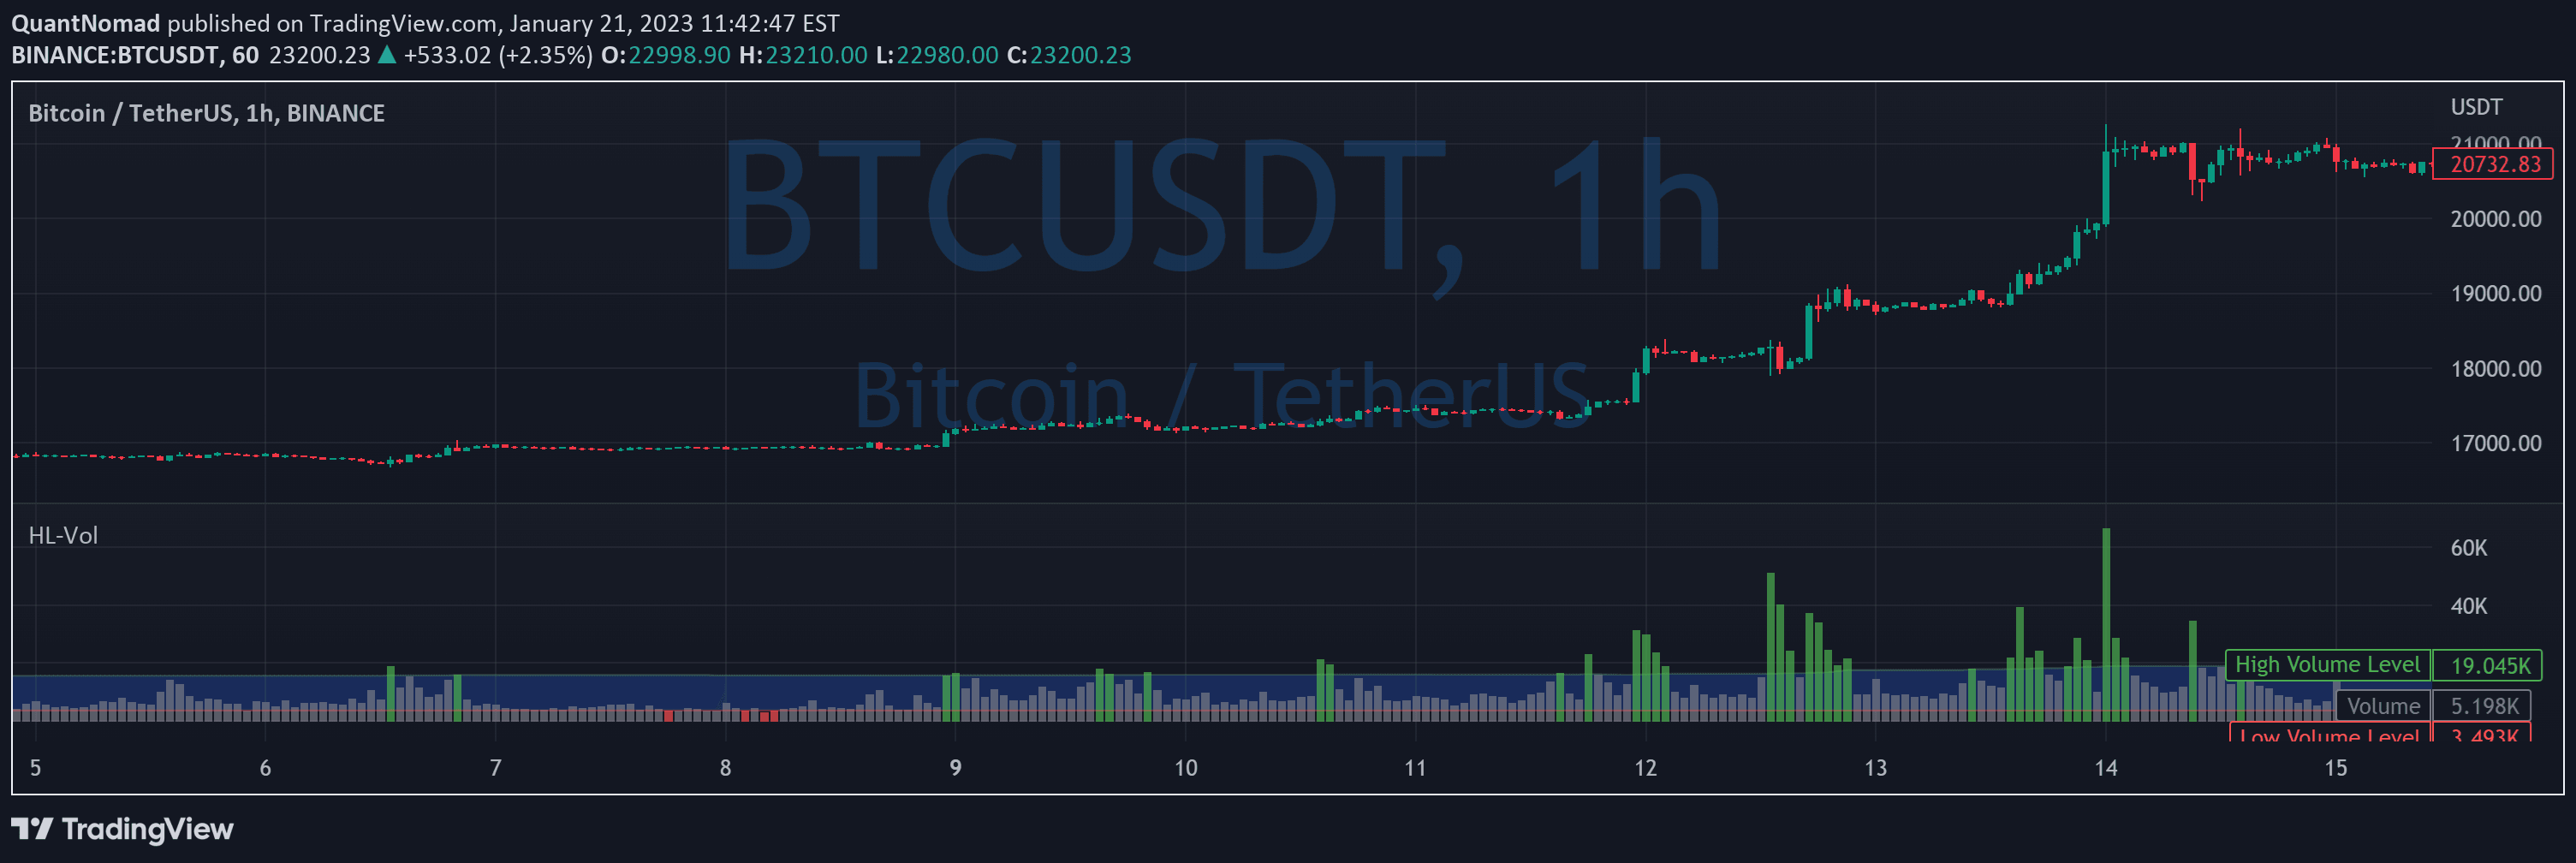
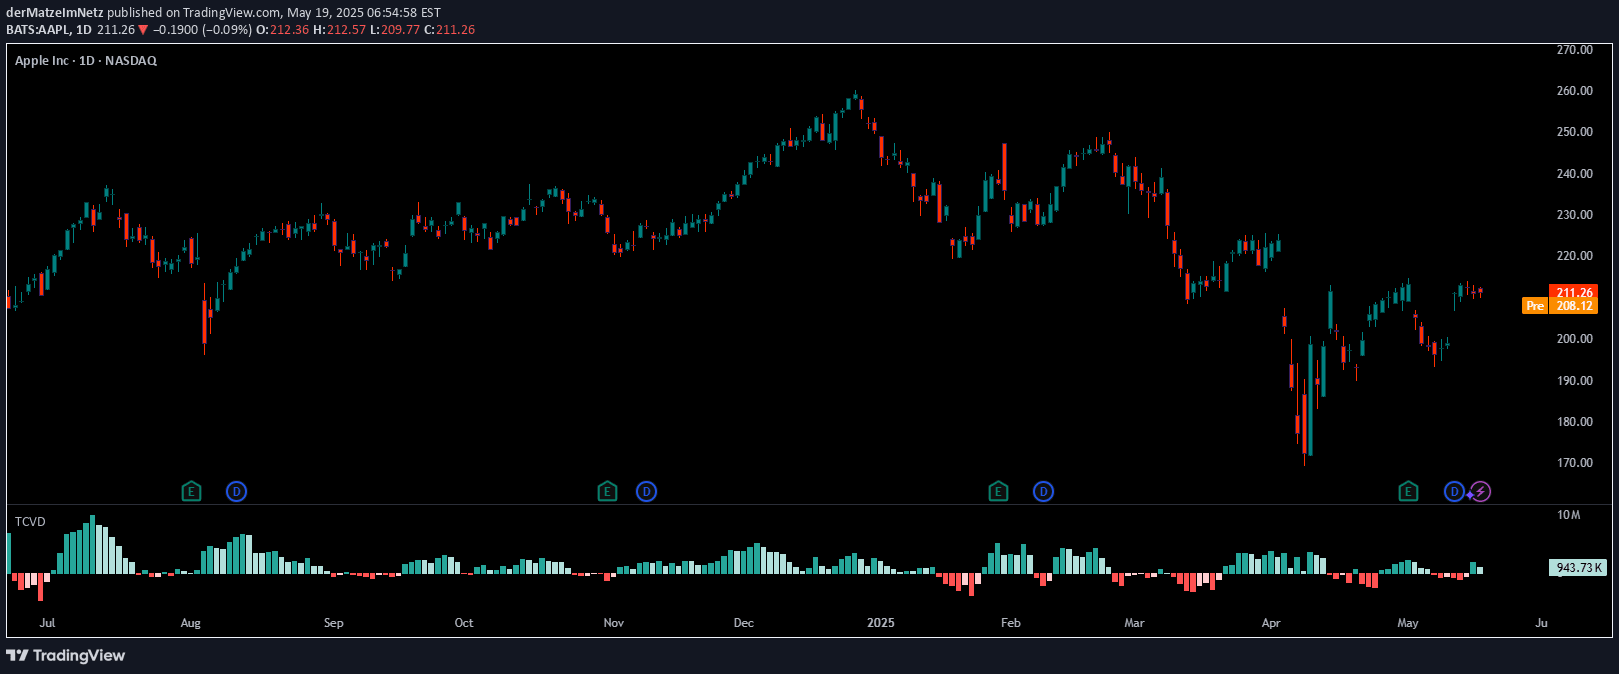
A volume-based indicator that highlights the most active trading candles, helping traders identify significant market moments with color-coded volume visualization.
Explore complementary indicator rolesHow it works
The High Volume Candles Indicator scans through price chart candles to identify and mark those with the highest trading volume during a specified time frame. It analyzes the total volume traded for each candle, comparing and ranking them to determine the most significant trading periods.
The indicator uses color coding to provide quick visual insights: green candles represent periods of high buying volume, while red candles indicate substantial selling activity. Traders can customize the time frame and number of candles to be analyzed, allowing flexibility in detecting volume-based market movements.
Why it may be useful
Volume is a critical indicator of market sentiment and potential price movements, providing traders with insights into the strength and conviction behind price actions. By highlighting the most active trading periods, this indicator helps traders understand where significant market interest is concentrated.
The visual representation allows quick identification of potential trend changes, breakouts, or consolidation periods. Traders can use these volume signals to confirm price movements, validate trading strategies, and make more informed decisions about market entry and exit points.
When to explore it
The High Volume Candles Indicator is most effective during volatile market conditions or when trading instruments with high liquidity, such as major stock indices, forex pairs, or popular cryptocurrencies. It works best when combined with other technical analysis tools to confirm signals and provide comprehensive market insights.
Traders should pay special attention to candles with exceptionally high volume, as these often indicate significant market events, potential trend reversals, or breakout opportunities. The indicator is particularly useful for short-term trading strategies like scalping and day trading, where rapid market movements and volume changes are crucial.
Keep exploring
What we’ve verified
Access, alerts and repainting behaviour have not been independently verified for this indicator. Check the creator’s current publication and settings.
General descriptions and classifications are recovered research. Verified details above identify the specific checks we have completed. Check the creator’s current publication for later changes.