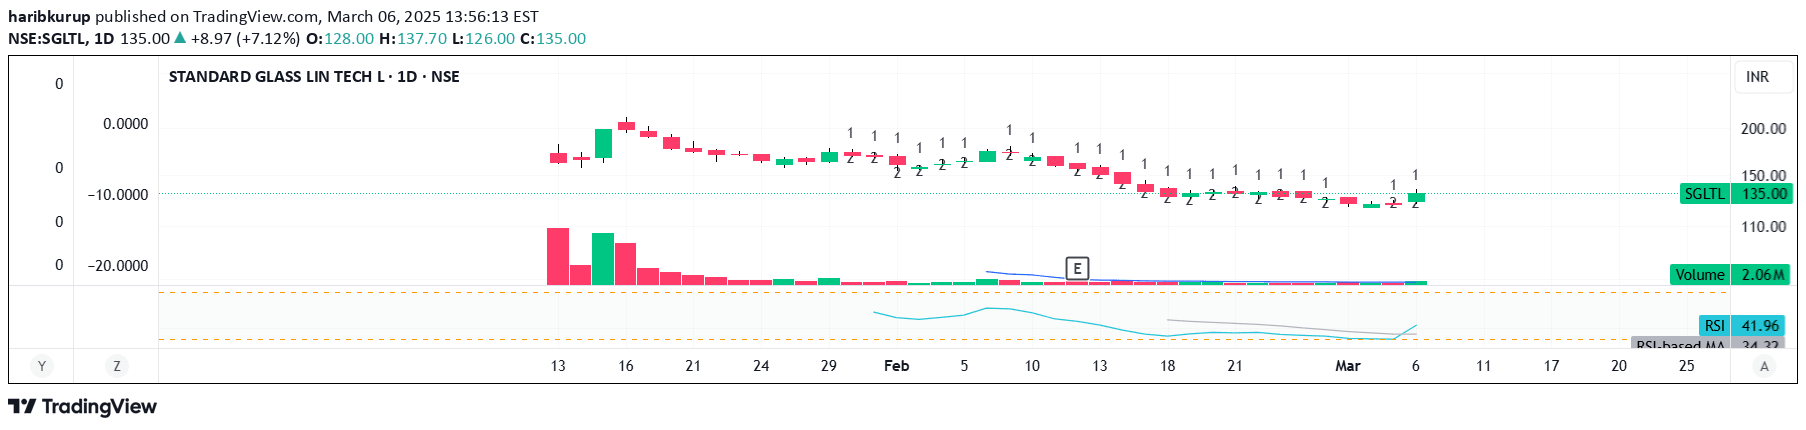
Vacuum Candles identify price inefficiencies by marking candles where price movement lacks sufficient volume support, signaling potential trend weaknesses or reversals.
Explore complementary indicator rolesHow it works
The Vacuum Candles indicator analyzes price movement relative to trading volume across a specified number of candles. By calculating an average price movement and volume, it determines when a candle's price action is disproportionate to its trading volume.
When the price movement exceeds a defined threshold without corresponding volume, the candle is marked as inefficient, typically with a darker or black body. The indicator uses two key inputs: Length, which determines the number of candles used in calculation, and a Multiplier that controls the sensitivity of inefficiency detection.
Why it may be useful
Identifying price inefficiencies helps traders recognize potential market weaknesses before significant trend reversals. By highlighting candles where price movement lacks volume confirmation, traders can anticipate possible false breakouts, breakdowns, or trend exhaustion.
This approach provides an additional layer of market analysis beyond traditional price action, helping traders make more informed decisions about entries, exits, and potential trend changes. The ability to detect subtle market inefficiencies can significantly improve trading strategy and risk management.
When to explore it
The Vacuum Candles indicator is most effective in markets with significant price movements and variable trading volumes. It works particularly well during transitional market phases, such as when a trend might be losing momentum or preparing to reverse.
Traders should use this indicator in conjunction with other technical analysis tools to confirm signals. It is especially useful in volatile markets, during news events, or when trading instruments with irregular volume patterns, helping to filter out potentially misleading price movements.
Keep exploring
What we’ve verified
Access, alerts and repainting behaviour have not been independently verified for this indicator. Check the creator’s current publication and settings.
General descriptions and classifications are recovered research. Verified details above identify the specific checks we have completed. Check the creator’s current publication for later changes.