Rough Average
A unique technical indicator that calculates a modified average using price scale and RSI profile to provide insights into market dynamics and potential trading opportunities.
Explore 11,183 indicators. Filter beyond the obvious.
Discover the tools that fit the way you trade.
11,183 tools to explore
A unique technical indicator that calculates a modified average using price scale and RSI profile to provide insights into market dynamics and potential trading opportunities.
A dynamic trend visualization indicator using Simple Moving Average crossovers to identify potential buy and sell signals across different market conditions and timeframes.
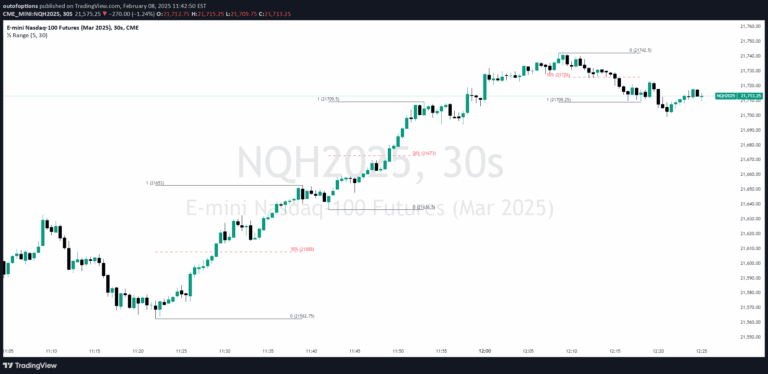
A price range indicator that identifies 50% retracement zones between swing highs and lows, providing potential entry and target points for traders based on price action dynamics.
A volume surge analysis indicator that detects significant market activity by measuring volume relative to its moving average and analyzing price movement direction and momentum.
A comprehensive Forex trading tool that tracks and visualizes market activity across four key trading sessions, providing insights into price changes and volatility in real-time.
The Price Percentage Breakout by Time Period (P%BTP) indicator identifies potential trading opportunities by measuring price change percentage relative to a historical lookback period.
The Price Percentage Breakout indicator identifies significant price movements by calculating percentage changes between open and close prices, highlighting potential trading opportunities.
A trading system that identifies potential market reversals by detecting pin bars and inside bars, providing visual cues for traders to recognize consolidation and potential trend changes.
The Price Percentage Shaded Candles indicator visually represents price movement intensity by adjusting candle shading based on the percentage change between open and close prices.
An hourly trading indicator that analyzes instrument behavior by tracking price changes, volume percentages, and statistical relevance across different trading hours.
A trading indicator that combines volume dynamics, price action patterns, and Point of Control to highlight potential high-probability trade zones with customizable sensitivity settings.
Candle Color Overlay is a visual trading tool that color-codes price chart candles to instantly reveal market sentiment and price movement direction.
Likes, views, and comments are historical TradingView snapshots. They describe attention, not trading performance.