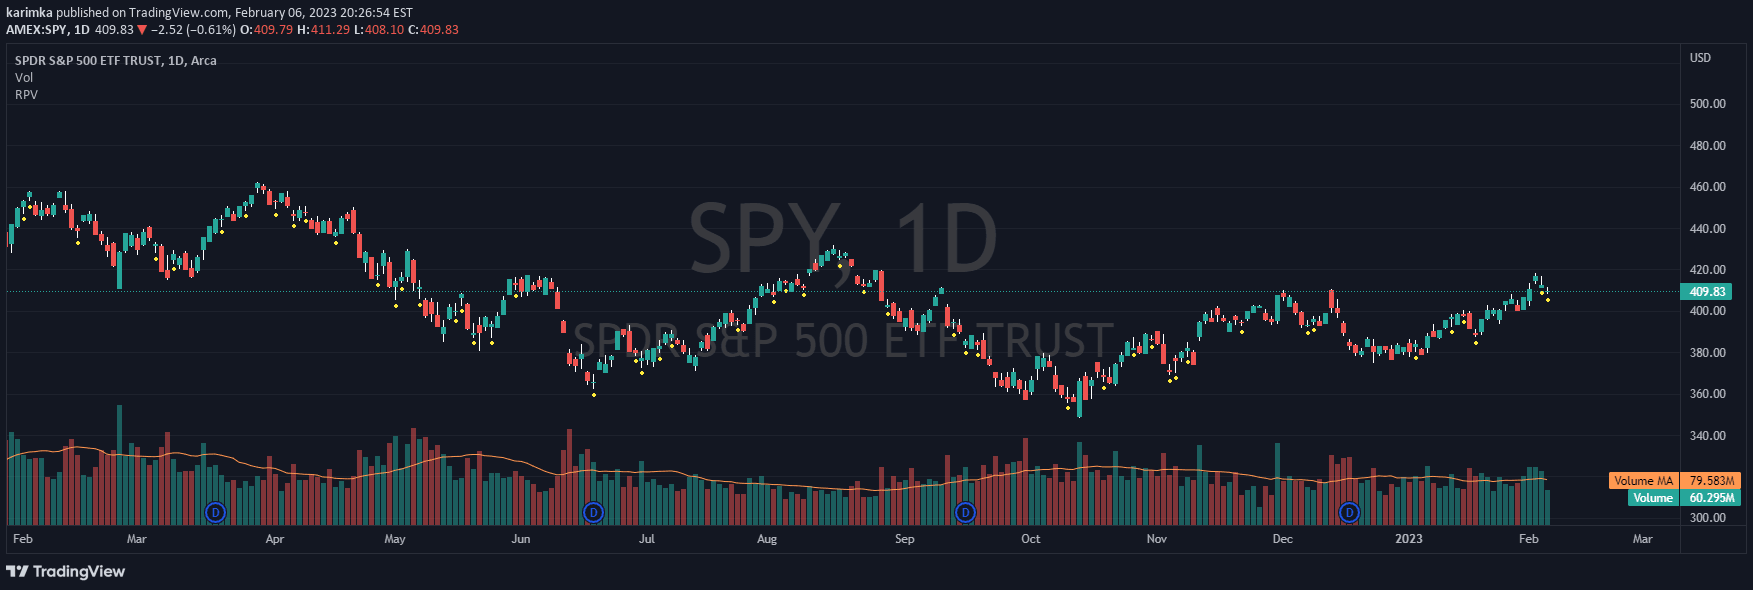
A trading indicator that combines volume dynamics, price action patterns, and Point of Control to highlight potential high-probability trade zones with customizable sensitivity settings.
Explore complementary indicator rolesHow it works
This indicator analyzes market dynamics by tracking volume spikes, price action patterns, and the Point of Control (POC) from recent candles. It uses a sophisticated algorithm to detect absorption signals, false moves, and unique price formations like inside bars, pin bars, and engulfing candles.
The system calculates volume variations by comparing current volume against recent average volumes, applying customizable multipliers to identify significant trading activity. By plotting the POC as a horizontal level and recognizing specific candlestick patterns, the indicator provides traders with visual cues about potential market movements and underlying trading sentiment.
Why it may be useful
Traders benefit from this indicator's multi-dimensional approach to market analysis, which combines volume, price action, and structural insights into a single comprehensive tool. By integrating Wyckoff-inspired logic with modern volume analysis, the indicator helps traders identify high-probability trading opportunities that might be missed by traditional single-dimensional indicators.
The customizable nature of the signal allows traders to adapt the sensitivity to their specific trading style and market conditions, making it a versatile tool for understanding market dynamics. Its ability to highlight absorption, false moves, and key price action patterns provides traders with a nuanced view of potential market reversals and continuation scenarios.
When to explore it
This indicator is most effective on 10-minute charts, particularly during intraday trading sessions and around key market events like session opens and POC re-tests. Traders should use it in conjunction with other technical analysis tools such as support and resistance levels, VWAP, or moving averages to confirm signals.
The indicator's effectiveness increases when applied to liquid markets with consistent volume patterns. Traders can adjust the settings to generate fewer, higher-quality signals by increasing volume spike multipliers or more frequent signals by lowering sensitivity thresholds, making it adaptable to different trading approaches and market conditions.
Keep exploring
What we’ve verified
Access, alerts and repainting behaviour have not been independently verified for this indicator. Check the creator’s current publication and settings.
General descriptions and classifications are recovered research. Verified details above identify the specific checks we have completed. Check the creator’s current publication for later changes.