Volume Profile / Fixed Range
A Volume Profile indicator that calculates trading volumes within a fixed range, helping traders understand volume distribution and identifying key price levels with visual representation.
Explore 11,183 indicators. Filter beyond the obvious.
Discover the tools that fit the way you trade.
11,183 tools to explore
A Volume Profile indicator that calculates trading volumes within a fixed range, helping traders understand volume distribution and identifying key price levels with visual representation.
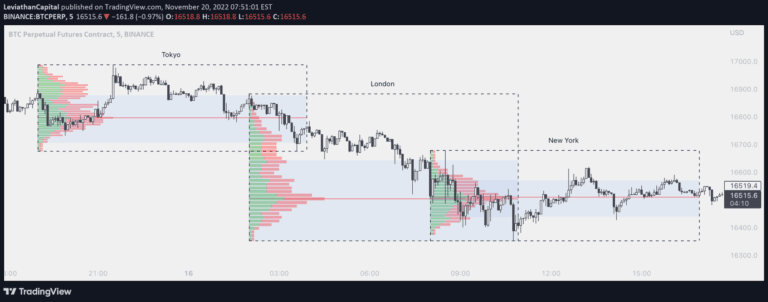
A comprehensive forex market session tracker with Volume Profile analysis that allows traders to visualize trading activity across different global market sessions and timeframes.
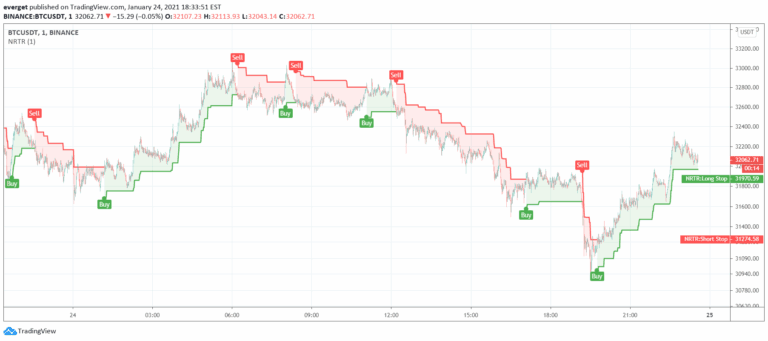
Nick Rypock Trend Reversal (NRTR) is a dynamic price channel indicator that tracks trend direction by measuring price extremes and percentage deviation from peak or bottom.
A volume profile indicator that reveals trading activity at price levels, highlighting key support and resistance zones through volume analysis and detecting market liquidity dynamics.
A charting tool that tracks money flow and trading pressure across different price ranges, revealing market sentiment and significant price levels through buying and selling activity visualization.
Volume Profile is a trading indicator that maps trading volume across different price levels, revealing key market insights like Value Area, Point of Control, and session price ranges.
A comprehensive market analysis tool tracking price frequency and trading volume to reveal market dynamics, support/resistance levels, and fair value zones.
Volume Footprint Voids is a trading indicator that uses lower timeframe calculations to plot single candle Point of Control (POC) and identify volume imbalances for precise entry and exit points.
A volume heatmap indicator that identifies price levels with the most trading volume, helping traders find key market activity zones and potential value trading targets.
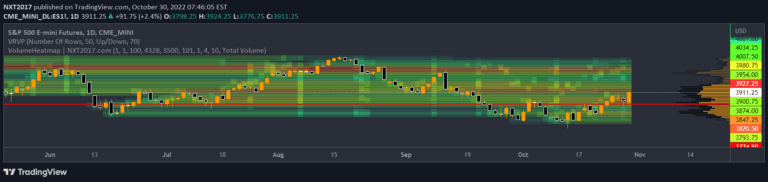
Advanced volume analysis tool that creates a heatmap and volume profile, providing detailed insights into trading volume, price movements, and market structure across different time frames.
An advanced liquidity heatmap that accumulates and tracks resting liquidity levels over time, revealing potential high-impact price zones by aggregating volume across multiple price levels.
A real-time volume delta and tick indicator providing detailed insights into market dynamics by analyzing live trading updates, focusing on price action and volume information at small timeframes.
Likes, views, and comments are historical TradingView snapshots. They describe attention, not trading performance.