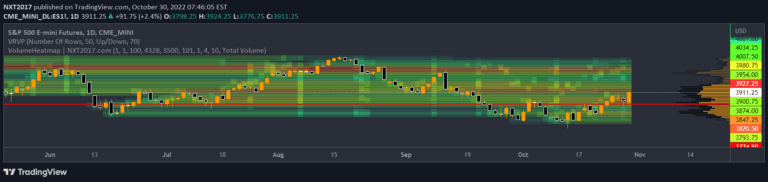
Advanced volume analysis tool that creates a heatmap and volume profile, providing detailed insights into trading volume, price movements, and market structure across different time frames.
Explore complementary indicator rolesHow it works
The volume analysis tool begins by gathering price and volume data from lower time frames, analyzing up to 100K candles per timeframe. It calculates price movements and volume distribution, creating color-coded boxes representing volume intensity and price changes.
The tool generates a heatmap with customizable rows and columns, highlighting volume concentrations. It can display volume profiles with up to 25 rows, showing Value Area, Value Area High, and Value Area Low. The script intelligently handles markets with non-continuous trading by combining data without gaps
Why it may be useful
Volume analysis provides crucial insights into market dynamics that price alone cannot reveal. By visualizing volume distribution, traders can identify key support and resistance levels, understand market sentiment, and detect potential trend reversals.
The heatmap and volume profile help traders understand where most trading activity occurs, revealing institutional interest and potential price equilibrium zones. This comprehensive view allows traders to make more informed decisions by understanding the underlying market structure and volume dynamics
When to explore it
This volume analysis tool is most effective in markets with consistent trading volumes and clear price structures. It works best for traders seeking detailed volume insights across different timeframes. Ideal for identifying potential trend reversals, confirming price movements, and understanding market sentiment.
Particularly useful for day traders and swing traders who want to analyze volume concentration and market structure. Works well with liquid markets like major stock indices, forex pairs, and high-volume commodities
Keep exploring
What we’ve verified
Access, alerts and repainting behaviour have not been independently verified for this indicator. Check the creator’s current publication and settings.
General descriptions and classifications are recovered research. Verified details above identify the specific checks we have completed. Check the creator’s current publication for later changes.