Bjorgum Key Levels
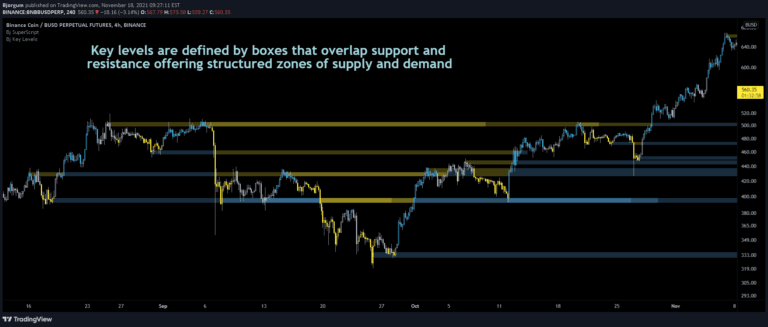
Key Levels strategy identifies critical price action points like breakouts, false breakouts, and backchecks to help traders understand market movement and potential trading opportunities.
Explore 11,183 indicators. Filter beyond the obvious.
Discover the tools that fit the way you trade.
11,183 tools to explore
Key Levels strategy identifies critical price action points like breakouts, false breakouts, and backchecks to help traders understand market movement and potential trading opportunities.
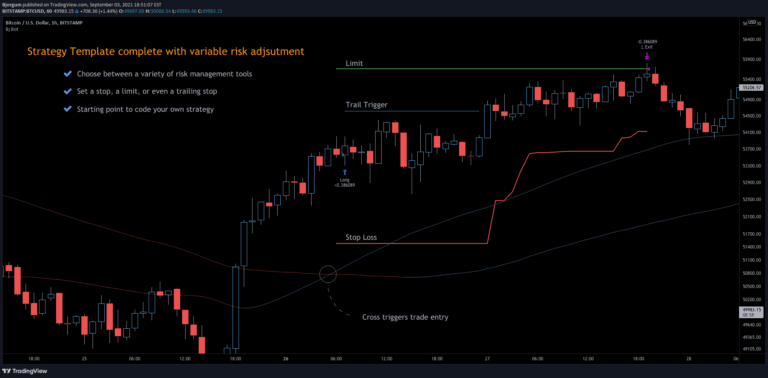
A 3Commas TradingView bot strategy offering automated trading with risk management, using moving average crossovers and customizable stop-loss and limit order settings.
Double Tap is a pattern recognition strategy that identifies double top and double bottom formations, providing entry signals based on price action reversals and breakout patterns.
A comprehensive trading framework designed to help traders develop, analyze, and manage trading strategies with advanced risk and reward tracking capabilities across multiple market conditions.
A dynamic trading panel displaying multiple technical indicators in a color-coded table format, allowing traders to quickly assess market conditions across multiple symbols simultaneously.
Advanced volume analysis tool that creates a heatmap and volume profile, providing detailed insights into trading volume, price movements, and market structure across different time frames.
A customizable Pine Script indicator that generates a mini-chart displaying the last 10 candles with detailed visual settings, providing quick insights into recent price action and market behavior.
A TradingView script that displays quarterly earnings per share and sales data with year-on-year percentage changes, offering customizable visualization of financial performance metrics.
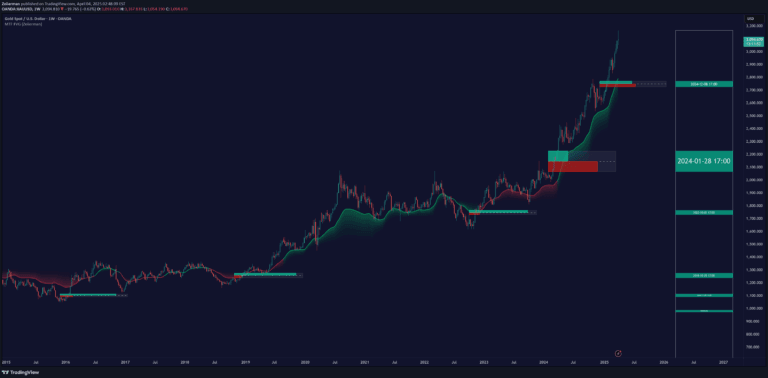
A multitimeframe indicator identifying institutional Fair Value Gaps through price imbalances, volume analysis, and trend filtering to highlight potential market inefficiencies and trading opportunities.
An autoregressive scatter plot forecaster that uses statistical coefficients to predict price movement by analyzing historical trends and creating probabilistic predictions.
A custom trading tool that generates monthly and yearly performance tables for trading strategies, helping traders analyze historical strategy performance and identify key periods of success or weakness.
A trading tool that identifies top-performing stocks within specific industry groups by analyzing performance metrics like YTD return and relative strength.
Likes, views, and comments are historical TradingView snapshots. They describe attention, not trading performance.