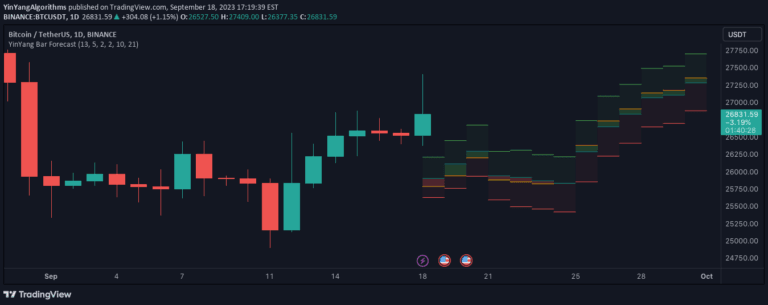
An autoregressive scatter plot forecaster that uses statistical coefficients to predict price movement by analyzing historical trends and creating probabilistic predictions.
Explore complementary indicator rolesHow it works
The autoregressive (AR) scatter plot forecaster operates by selecting a one-bar lag and performing a statistical assessment over a specified training time period. It learns from historical price data to develop statistical coefficients that can mimic current market trends and potential future movements.
By analyzing the historical price behavior, the indicator creates multiple prediction lines representing different confidence levels: green for the upper confidence prediction (best-case scenario), blue for the most likely result, and red for lower confidence scenarios.
Why it may be useful
This indicator provides traders with a statistical approach to forecasting potential price movements by leveraging historical data patterns and trend analysis. It offers multiple prediction scenarios that help traders understand potential market outcomes and make more informed trading decisions.
Unlike traditional predictive models, this approach uses pure statistical methods to generate forecasts, providing a unique perspective on potential price trajectories without relying on complex machine learning algorithms.
When to explore it
The autoregressive scatter plot forecaster works best when applied to markets with clear, identifiable trends and consistent price behaviors. Traders should use the Tradingview Regression tool to help determine the most appropriate training time and ensure alignment with the current strongest trend.
It is particularly effective when combined with other technical analysis tools and when traders can verify the model's reliability through high correlation and R2 values in the Model Data table.
Keep exploring
What we’ve verified
Access, alerts and repainting behaviour have not been independently verified for this indicator. Check the creator’s current publication and settings.
General descriptions and classifications are recovered research. Verified details above identify the specific checks we have completed. Check the creator’s current publication for later changes.