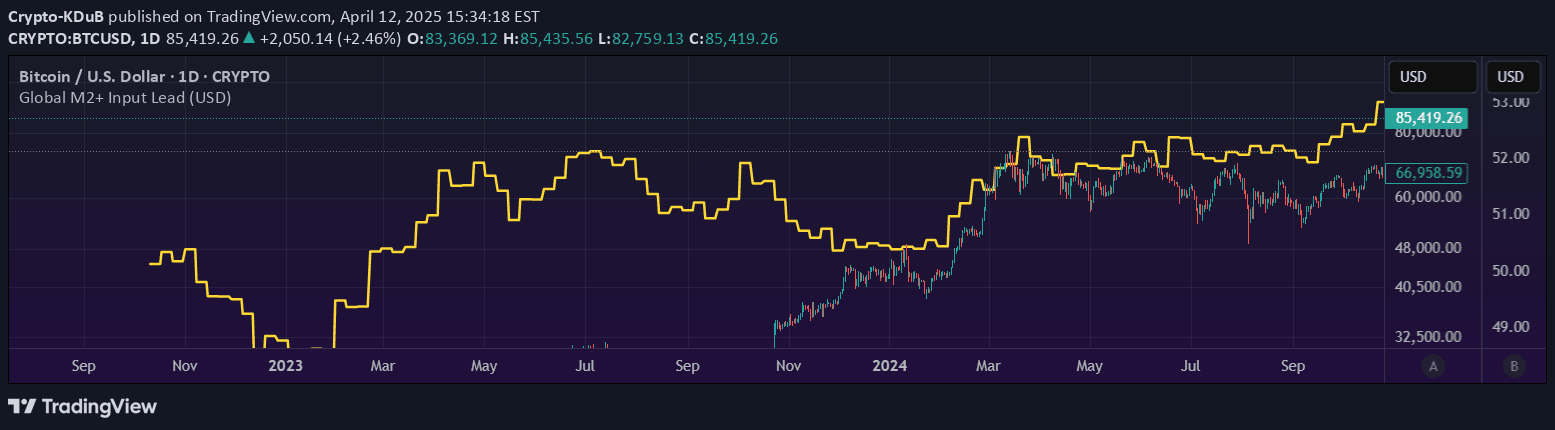
ARIMA is a time series forecasting model that analyzes historical price data to predict future price movements and provide confidence intervals for potential trend directions.
Explore complementary indicator rolesHow it works
ARIMA (AutoRegressive Integrated Moving Average) works by combining three key components: autoregression, differencing, and moving average to analyze time series data. It examines the relationship between an observation and its previous values, stabilizes the data through differencing, and considers the relationship between observations and residual errors.
The model automatically selects an appropriate lag length to ensure data stationarity and creates a moving average that can be shifted to reveal underlying trend patterns. By integrating these components, ARIMA can generate forecasts that capture the current trend's potential future trajectory.
Why it may be useful
ARIMA provides traders with a sophisticated forecasting tool that goes beyond simple trend analysis by offering nuanced insights into potential price movements. It can reveal both upward and downward trend scenarios, helping traders understand potential market directions with statistical confidence.
The model's ability to generate confidence intervals and forecast potential price ranges makes it valuable for risk management and strategic decision-making. By presenting multiple potential outcomes, traders can develop more robust trading strategies and better anticipate market movements.
When to explore it
ARIMA is most effective when applied to markets with relatively stable, predictable trends and sufficient historical data for accurate modeling. It works best on timeframes ranging from hourly to daily charts, where sufficient data points can be analyzed to generate meaningful predictions.
Traders should use ARIMA when seeking a more analytical approach to trend forecasting, particularly in markets with consistent price behaviors. It is particularly useful for stocks, forex, and other financial instruments with clear historical patterns and moderate volatility.
Keep exploring
What we’ve verified
Access, alerts and repainting behaviour have not been independently verified for this indicator. Check the creator’s current publication and settings.
General descriptions and classifications are recovered research. Verified details above identify the specific checks we have completed. Check the creator’s current publication for later changes.