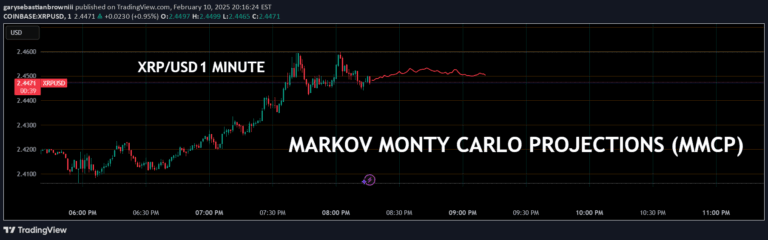
An advanced projection tool using Geometric Brownian Motion to simulate potential future price paths, offering statistical insights into expected price movements and confidence intervals.
Explore complementary indicator rolesHow it works
The Anchored GBM Projections indicator uses mathematical modeling to generate multiple potential future price scenarios based on historical data. It starts by calculating drift and volatility from historical returns, then generates numerous independent price simulation paths using Geometric Brownian Motion.
Each simulation path represents a potential future price trajectory, starting from a user-defined anchor point. The indicator generates multiple paths, calculates an expected value line, and creates 95% confidence bands to show the statistical range of potential price movements.
Why it may be useful
This indicator provides traders with a sophisticated statistical approach to understanding potential future price movements beyond traditional technical analysis. By simulating multiple scenarios, it helps traders visualize potential market outcomes and assess probabilistic price ranges.
The tool offers unique insights into market uncertainty, allowing traders to make more informed decisions by understanding the statistical likelihood of different price trajectories. Its ability to generate confidence intervals and expected value lines helps traders manage risk and set more strategic entry and exit points.
When to explore it
The Anchored GBM Projections indicator is most effective during periods of moderate market volatility where historical patterns can provide meaningful predictive insights. It works best when traders want to understand potential price ranges and statistical probabilities of future movements.
Traders should use this tool when analyzing markets with sufficient historical data and when seeking a more quantitative approach to forecasting potential price trajectories. It is particularly useful for traders who want to supplement their technical analysis with probabilistic modeling and risk assessment strategies.
Keep exploring
What we’ve verified
Access, alerts and repainting behaviour have not been independently verified for this indicator. Check the creator’s current publication and settings.
General descriptions and classifications are recovered research. Verified details above identify the specific checks we have completed. Check the creator’s current publication for later changes.