Multi-VWAP System
A multi-dimensional VWAP system that provides advanced volume-weighted average price analysis with institutional-grade insights across multiple anchoring points and deviation bands.
Explore 11,183 indicators. Filter beyond the obvious.
Discover the tools that fit the way you trade.
11,183 tools to explore
A multi-dimensional VWAP system that provides advanced volume-weighted average price analysis with institutional-grade insights across multiple anchoring points and deviation bands.
An automated trading indicator that identifies price consolidation zones and breakouts using Nicolas Darvas's box methodology, highlighting potential trend continuation or reversal signals.
A sophisticated price projection tool using Geometric Brownian Motion that simulates potential future price paths with expected value and adjustable confidence bands for strategic trading insights.
A tool tracking key price extremes across different trading sessions, helping traders identify breakouts, mean-reversion opportunities, and critical market structure levels.
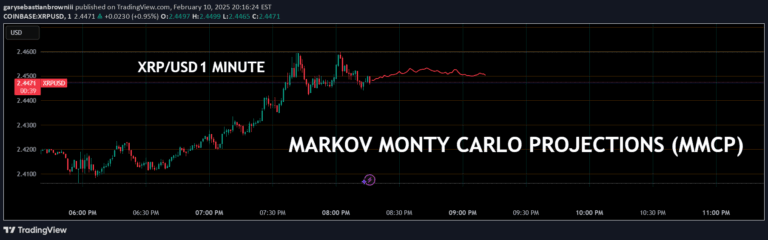
A probabilistic forecasting tool using Markov Chains and Monte Carlo simulations to generate potential future price paths by analyzing historical price movement probabilities and volatility.
An advanced projection tool using Geometric Brownian Motion to simulate potential future price paths, offering statistical insights into expected price movements and confidence intervals.
A powerful intrabar analysis tool that uses linear regression to detect early trend shifts and momentum changes within a single price bar, offering traders faster insights into market sentiment.
Anchored Darvas Box is a technical indicator that identifies price consolidation zones by freezing a range from a specific anchor candle and tracking potential breakouts with precision.
A multi-layered indicator using statistical techniques to reveal support and resistance levels in uptrends, highlighting critical price action zones through quantile and power-law analysis.
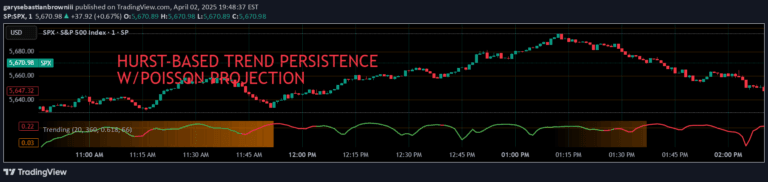
A statistically-driven trend oscillator that combines Hurst exponent analysis and Poisson probability to measure trend persistence, strength, and potential reversals.
A probabilistic technical indicator using Poisson distribution to project dynamic support and resistance levels with varying transparency based on historical price interactions.
An adaptive EMA-based indicator that provides early squeeze warnings and potential regime shift predictions by tracking EMA convergence and analyzing market behavioral dynamics.
Likes, views, and comments are historical TradingView snapshots. They describe attention, not trading performance.