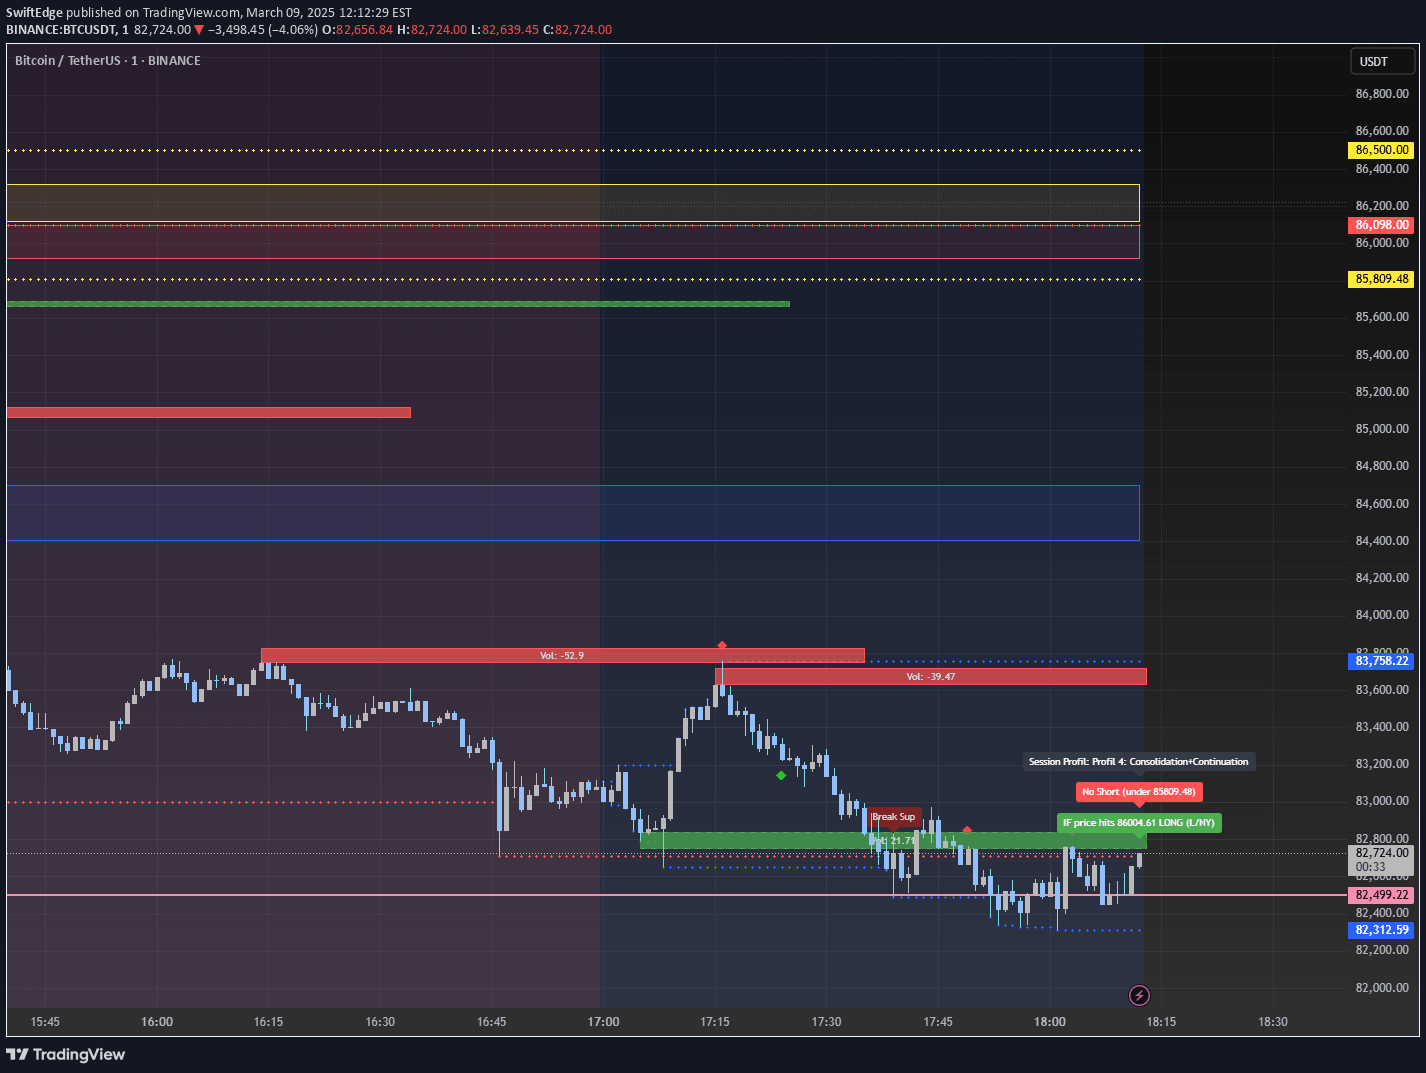
A tool tracking key price extremes across different trading sessions, helping traders identify breakouts, mean-reversion opportunities, and critical market structure levels.
Explore complementary indicator rolesHow it works
The Key Recent Highs & Lows (KRHL) indicator maps critical price levels across different trading sessions, including early premarket, western premarket, regular hours, and post-market. It automatically tracks and plots the highest and lowest price points for each session, using color-coded and styled lines to represent different timeframes.
These session-specific lines are dynamically updated in real-time, allowing traders to see precise market structure extremes. The tool automatically resets daily at midnight Eastern time, ensuring fresh and relevant market information is always available for traders to analyze and strategize.
Why it may be useful
Understanding session-specific price extremes provides traders with crucial market context that reveals potential liquidity pools and areas of institutional interest. These levels represent key psychological boundaries where significant market movements often initiate, helping traders anticipate potential breakouts or mean-reversion scenarios.
By visualizing these critical price levels, traders can make more informed decisions about entry, exit, and risk management. The indicator helps identify where resting orders might be located and highlights important market memory points that professional traders consistently monitor.
When to explore it
The KRHL indicator is most effective during volatile market conditions where price is testing key structural levels or potentially breaking out of established ranges. It works exceptionally well for traders seeking to understand intraday market dynamics and identify high-probability trading opportunities.
Traders should particularly leverage this tool during earnings seasons, economic announcements, or when significant market-moving news is expected. It is especially useful for active day traders and scalpers who require precise, real-time understanding of market structure and potential inflection points.
Keep exploring
What we’ve verified
Access, alerts and repainting behaviour have not been independently verified for this indicator. Check the creator’s current publication and settings.
General descriptions and classifications are recovered research. Verified details above identify the specific checks we have completed. Check the creator’s current publication for later changes.