
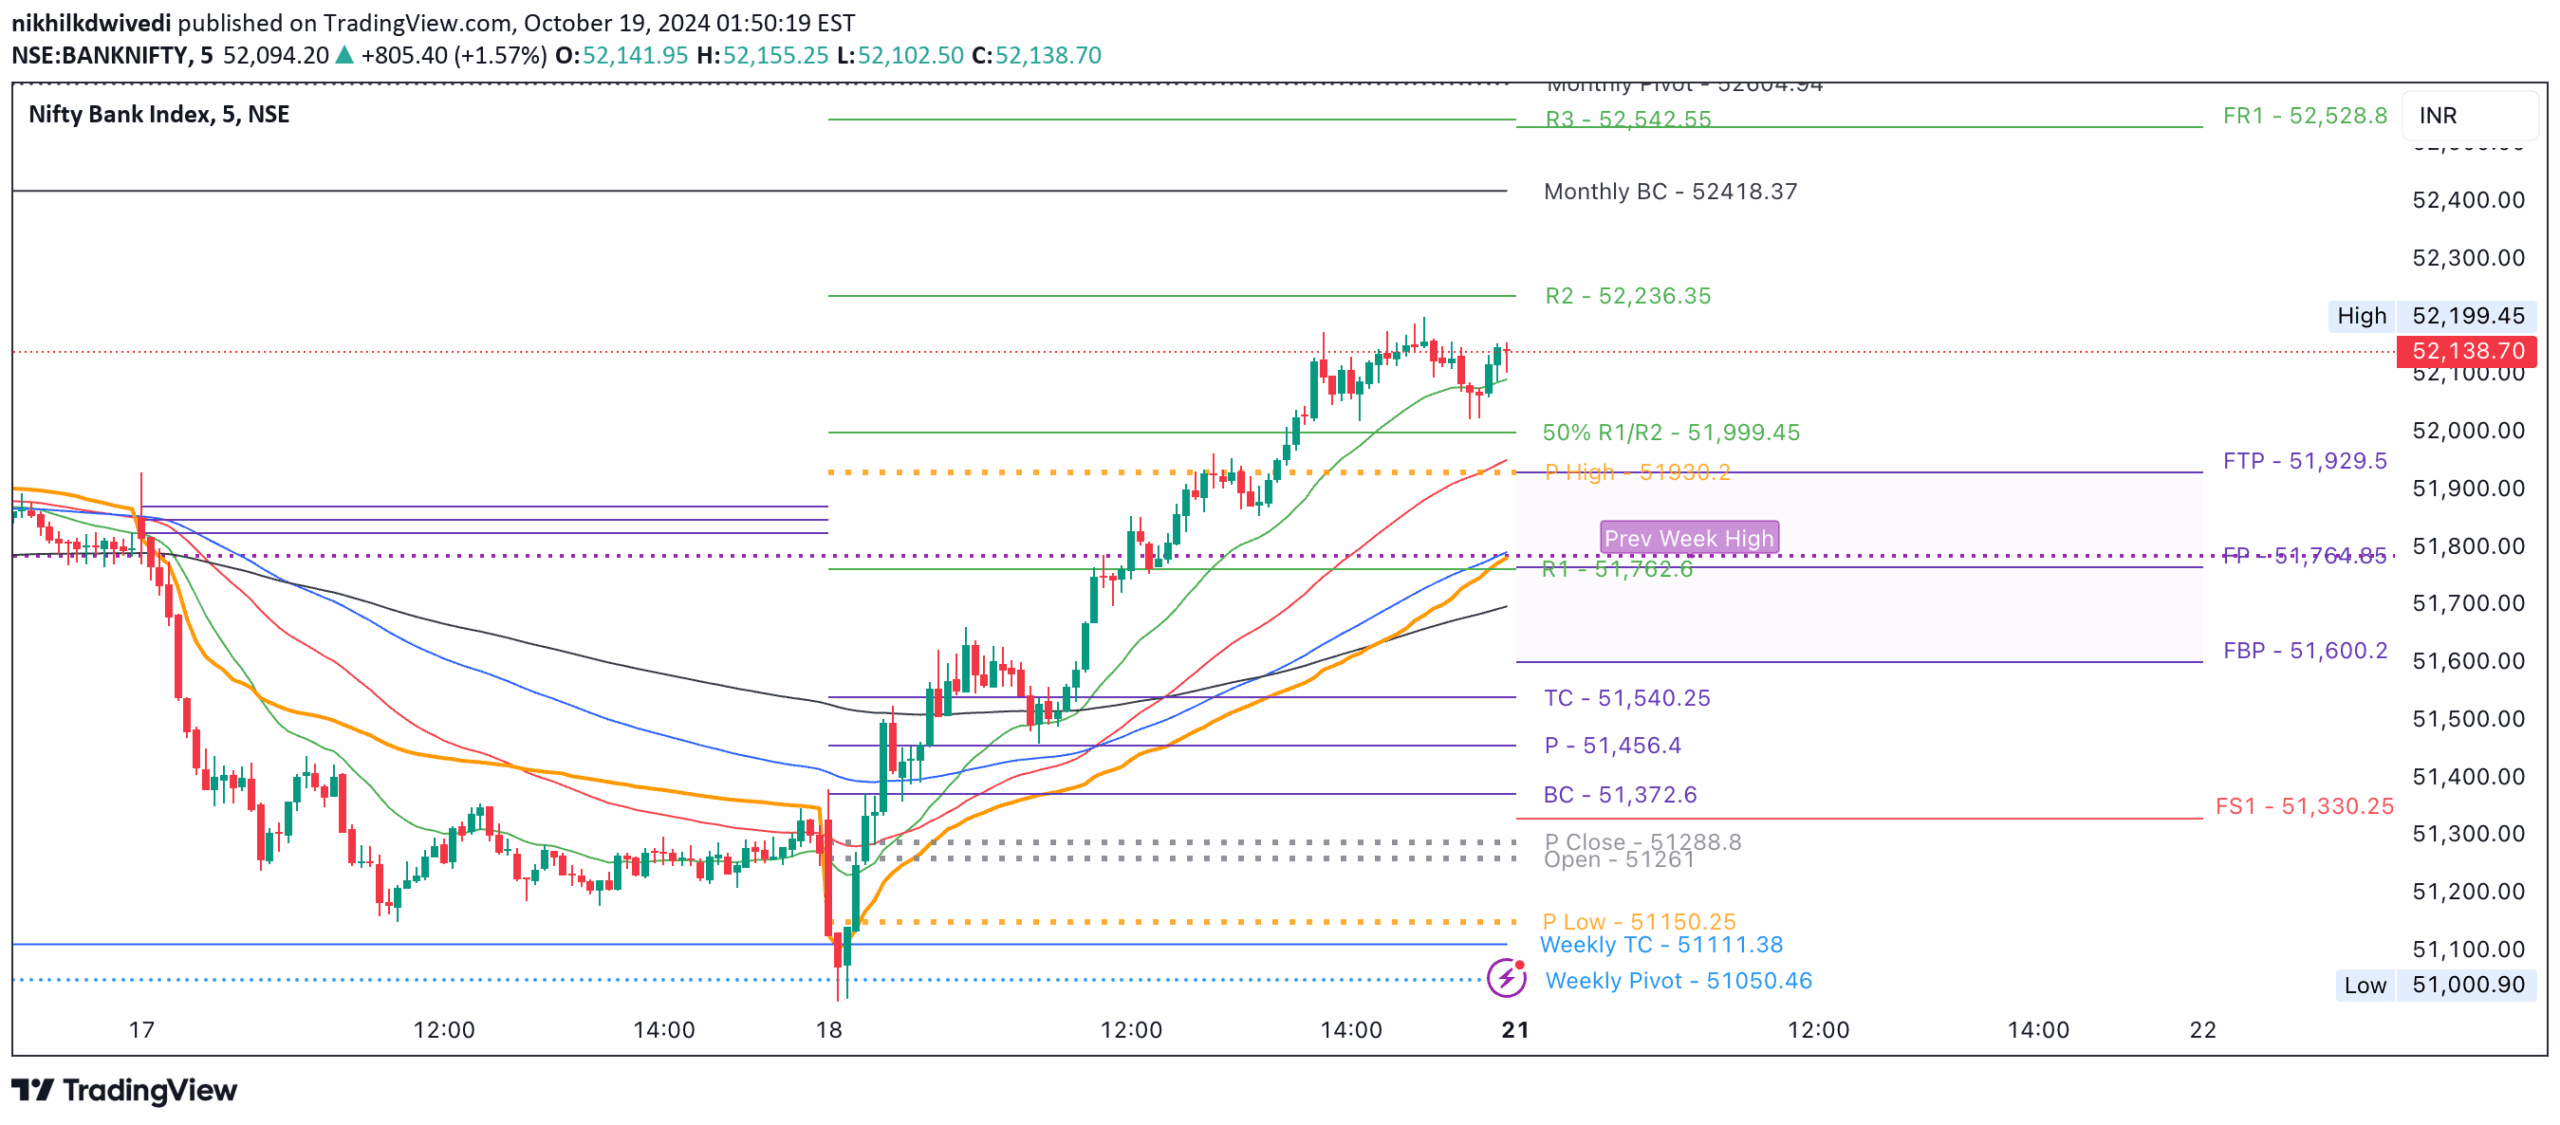
Central Pivot Range (CPR) is a technical analysis tool that identifies key support and resistance levels using previous day's price data to help traders understand market trends and potential entry/exit points.
Explore complementary indicator rolesHow it works
The Central Pivot Range calculates three primary levels: Pivot Point (PP), Upper Range (R1), and Lower Range (S1) using the previous day's high, low, and closing prices. These levels are computed by taking the average of these prices and then deriving resistance and support zones through mathematical formulas.
Advanced traders expand this to a 10-line system with multiple resistance and support levels, providing a more nuanced view of potential market movements. By adding R2, R3, S2, and S3 levels, traders gain a more comprehensive understanding of potential price reversal and continuation points.
Why it may be useful
The CPR provides traders with a structured approach to understanding market dynamics by offering clear, mathematically-derived support and resistance levels. It helps traders identify potential entry and exit points with greater precision, reducing uncertainty and providing a systematic framework for decision-making.
By offering multiple levels of support and resistance, the CPR allows traders to adapt to changing market conditions and make more informed trading decisions. It serves as a valuable tool for risk management, helping traders set stop-loss orders and determine potential profit targets based on established price levels.
When to explore it
The Central Pivot Range is most effective in markets with clear trend characteristics, where price movements tend to respect support and resistance levels. It works particularly well in stocks, forex, and futures markets with consistent daily trading volumes and predictable price action.
Traders should use CPR in conjunction with other technical indicators for confirmation, especially during periods of high market volatility or when significant economic events might disrupt typical price patterns. It is most reliable when used on daily or intraday charts with sufficient historical price data to establish robust pivot points.
Keep exploring
What we’ve verified
Access, alerts and repainting behaviour have not been independently verified for this indicator. Check the creator’s current publication and settings.
General descriptions and classifications are recovered research. Verified details above identify the specific checks we have completed. Check the creator’s current publication for later changes.


