Waindrops [Makit0]
A custom volume profile indicator that visualizes trading volume across custom time periods, splitting each period into halves and displaying volume and sentiment through color-coded histograms.
Explore 11,183 indicators. Filter beyond the obvious.
Discover the tools that fit the way you trade.
11,183 tools to explore
A custom volume profile indicator that visualizes trading volume across custom time periods, splitting each period into halves and displaying volume and sentiment through color-coded histograms.
Rolling VWAP Channel creates a dynamic indicator using multiple Volume Weighted Average Prices to analyze price clusters and potential market directional changes through percentile interpolation.
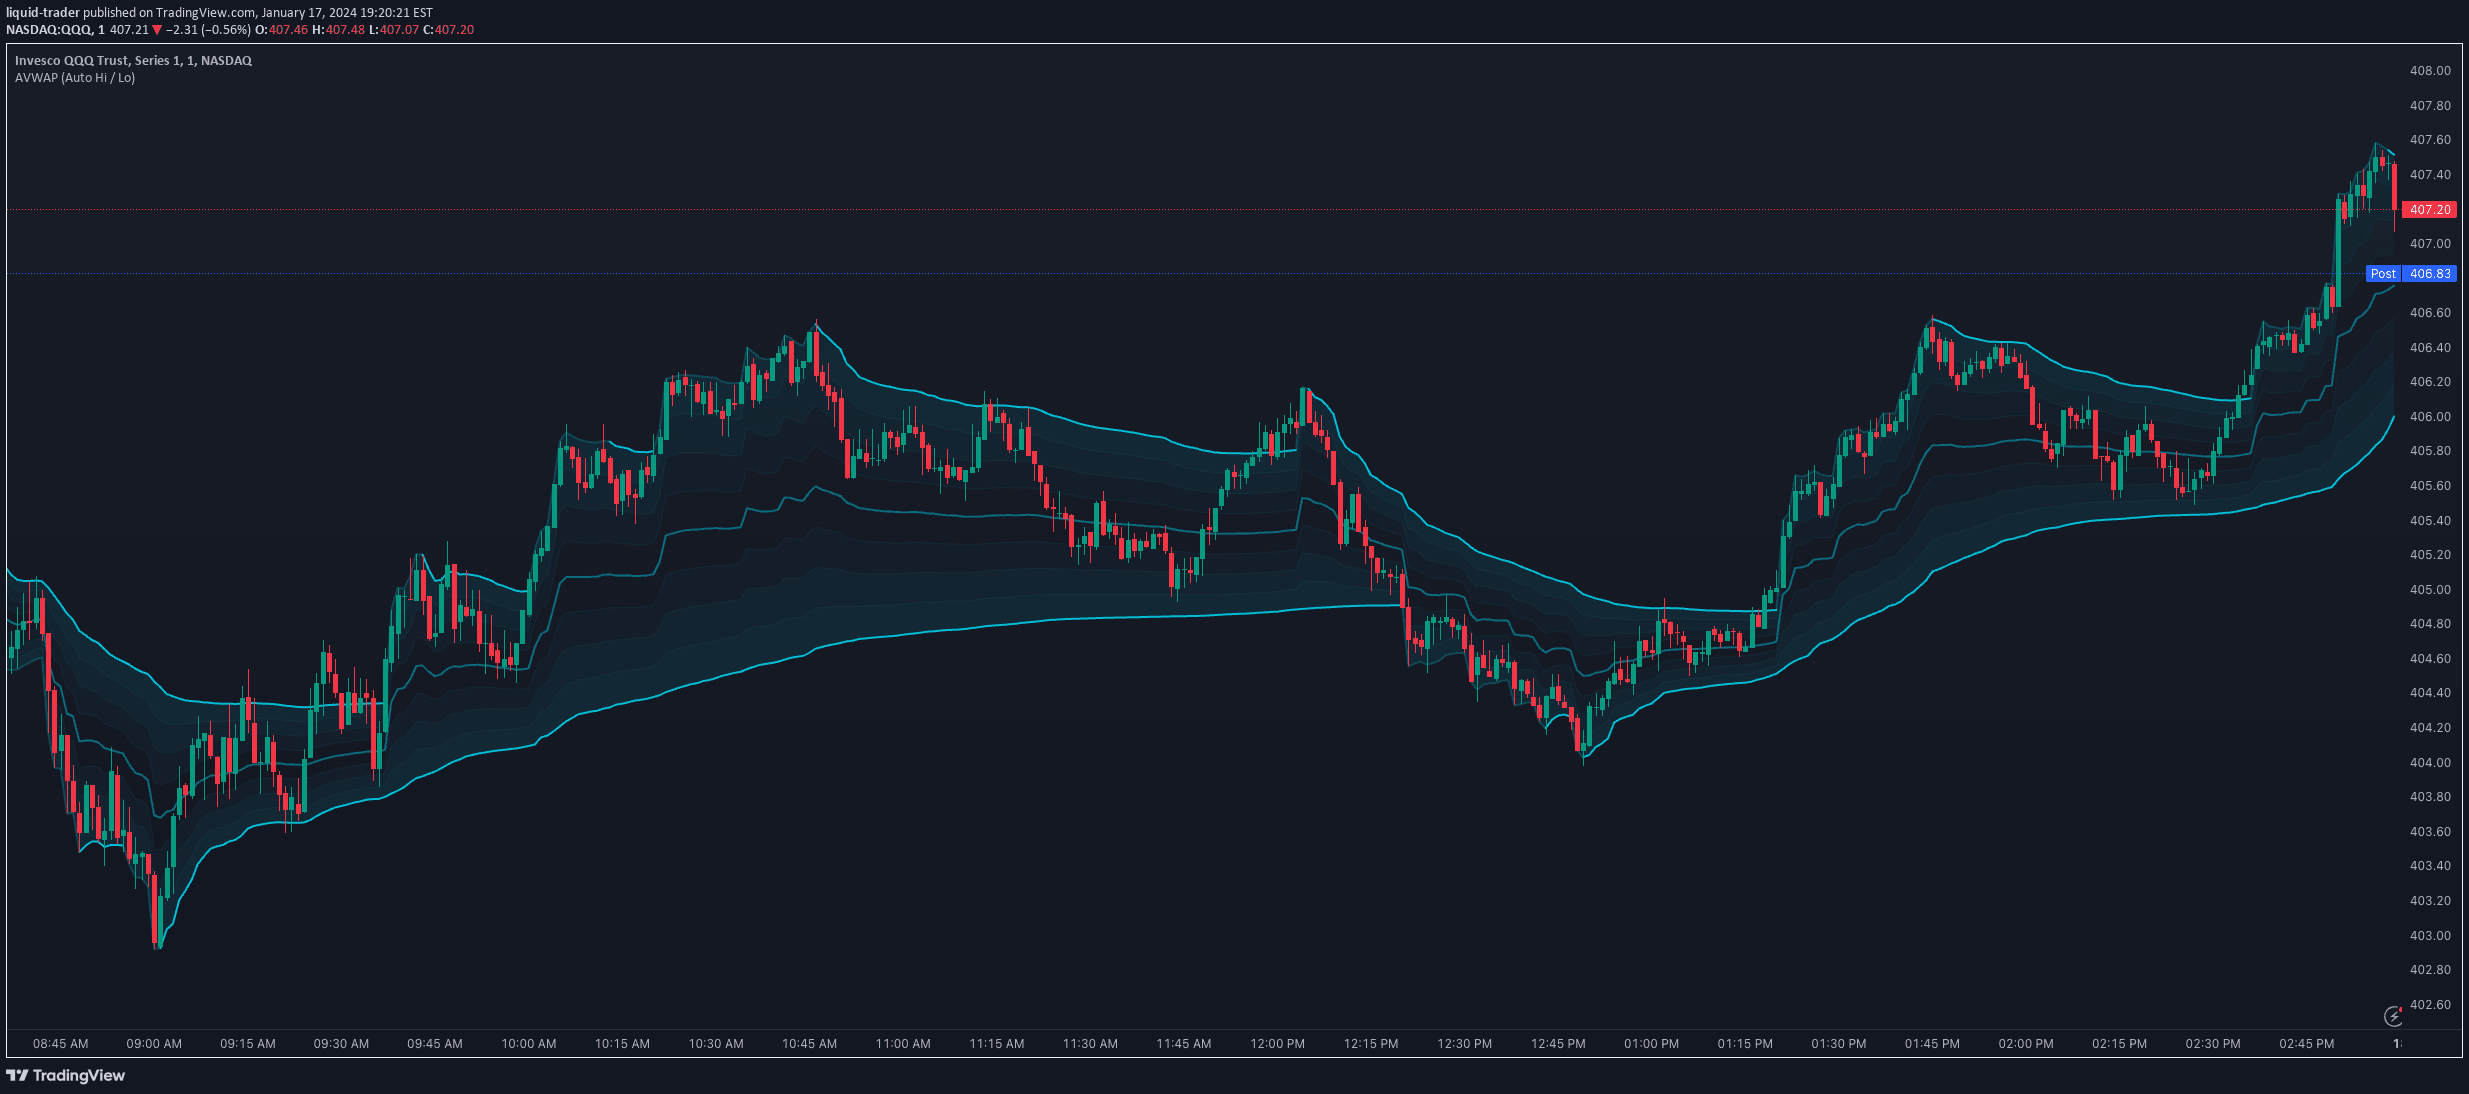
A multi-anchored VWAP indicator plotting three volume-weighted average price lines to help traders identify market trends, mean reversion, and potential breakout points.
A volume weighted average price (VWAP) indicator that allows traders to anchor and customize price analysis across multiple timeframes and periods with configurable settings.
A dynamic indicator that calculates anchored VWAPs and average prices using Zigzag pivot points, offering advanced market movement insights with customizable tail configurations.
Central Pivot Range (CPR) is a technical analysis tool that identifies key support and resistance levels using previous day's price data to help traders understand market trends and potential entry/exit points.
An advanced trading indicator that identifies consolidation periods and anchors three unique VWAPs to key price points, helping traders analyze volume-weighted average prices during market pauses.
VWAP is a volume-weighted average price indicator that tracks price movement relative to volume, helping traders identify potential support and resistance levels.
A multi-indicator trading strategy combining EMA, VWAP, and SuperTrend to generate high-probability entry and exit signals by analyzing price movement and trend direction.
A customizable VWAP indicator with 32 levels that helps traders identify price positioning relative to volume-weighted average price levels with color-coded visual representation.
A sophisticated multi-timeframe indicator offering custom session analysis, VWAP, and Fibonacci levels to enhance traders' understanding of market dynamics and potential price movements.
A multi-timeframe VWAP tool that automatically tracks and preserves historical volume-weighted average price lines, revealing key support and resistance zones across different market periods.
Likes, views, and comments are historical TradingView snapshots. They describe attention, not trading performance.