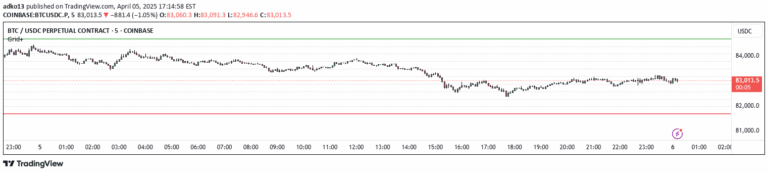
A customizable VWAP indicator with 32 levels that helps traders identify price positioning relative to volume-weighted average price levels with color-coded visual representation.
Explore complementary indicator rolesHow it works
The VWAP indicator calculates volume-weighted average price across multiple timeframes using 32 different levels and unique labeling techniques. It dynamically plots these levels on the chart, providing traders with a comprehensive view of price movement in relation to volume-weighted price points.
The indicator uses four distinct color codes to represent price strength and trend direction, enabling quick visual interpretation of market dynamics. By incorporating customizable features like label padding, plot styles, and significant figure rounding, traders can tailor the indicator to their specific analytical preferences and trading strategies.
Why it may be useful
VWAP levels serve as critical support and resistance zones that reflect the average price weighted by trading volume, offering traders valuable insights into market sentiment and potential price reversals. By understanding where current price stands relative to these volume-weighted levels, traders can make more informed decisions about market entry and exit points.
The color-coded system and customizable features reduce cognitive load and allow traders to quickly assess market conditions across different timeframes. This approach helps traders identify potential trend changes, confirm price movements, and develop more strategic trading approaches based on volume-weighted price information.
When to explore it
The VWAP indicator is most effective during active trading sessions with significant volume, particularly for intraday and short-term trading strategies. Traders can use this tool to identify potential support and resistance levels, confirm trend strength, and make more precise entry and exit decisions.
It works particularly well when combined with other technical indicators like EMA crossovers, providing multiple confirmation signals for potential trade opportunities. The indicator is especially useful at the beginning of new trading periods like weeks or months when price levels might converge, offering traders additional context for their market analysis.
Keep exploring
What we’ve verified
Access, alerts and repainting behaviour have not been independently verified for this indicator. Check the creator’s current publication and settings.
General descriptions and classifications are recovered research. Verified details above identify the specific checks we have completed. Check the creator’s current publication for later changes.