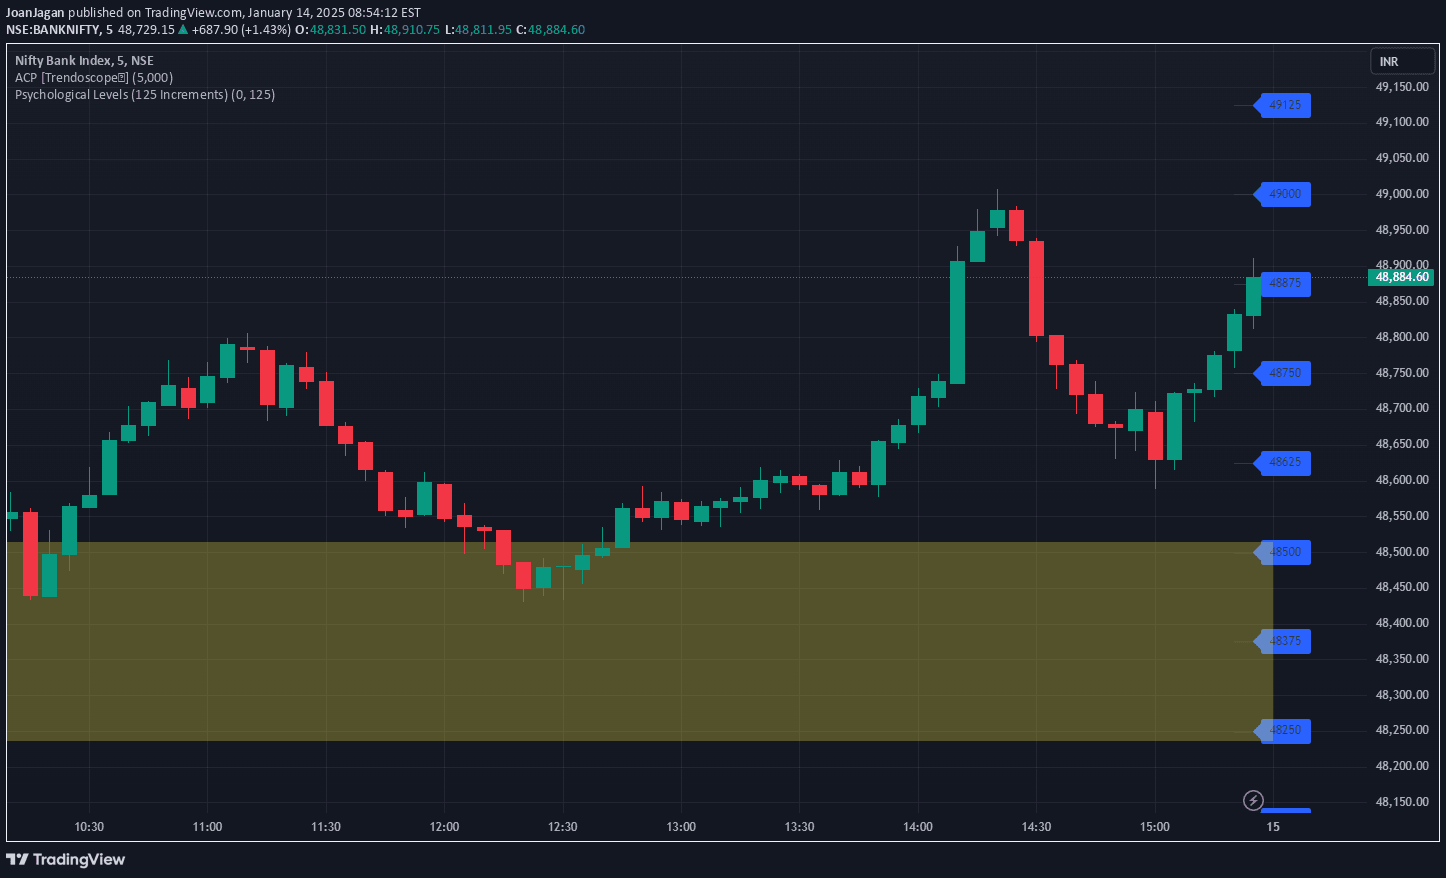
A dynamic indicator that identifies key support and resistance levels by analyzing price action, candlestick patterns, and market movements to help traders spot potential reversal points.
Explore complementary indicator rolesHow it works
The Peak & Valley Levels indicator operates by meticulously analyzing candle length, direction, and volume to detect potential market turning points. It identifies peaks and valleys through a sophisticated algorithm that examines how candlesticks interact with previous price action, looking for specific pattern characteristics that suggest potential resistance or support levels.
The script dynamically adjusts these levels based on ongoing market movements, ensuring that the identified support and resistance zones remain relevant and accurate. By using both bullish and bearish rejection functions, the indicator can assess whether a particular candlestick pattern validates or challenges the detected market levels.
Why it may be useful
Traders benefit from this indicator's ability to provide clear, visual representations of critical market levels where price reversals are likely to occur. By highlighting potential support and resistance zones, the script offers traders a strategic advantage in understanding market dynamics and identifying high-probability trading opportunities.
The indicator's versatility allows traders to adapt their strategies across different trading styles, from scalping to swing trading. Its dynamic nature means traders can gain insights into market sentiment and potential trend changes, helping them make more informed decisions about entry and exit points.
When to explore it
The Peak & Valley Levels indicator works best in markets with clear price action and distinct candlestick patterns. It is particularly effective in trending markets where price consistently respects support and resistance levels, providing traders with reliable signals for potential reversals or continuation patterns.
Traders should consider using this indicator in conjunction with other technical analysis tools to confirm signals and reduce false positives. It is most valuable when applied to timeframes that allow for meaningful candlestick analysis, such as 15-minute, 1-hour, or daily charts, where the patterns and levels can be more clearly distinguished.
Keep exploring
What we’ve verified
Access, alerts and repainting behaviour have not been independently verified for this indicator. Check the creator’s current publication and settings.
General descriptions and classifications are recovered research. Verified details above identify the specific checks we have completed. Check the creator’s current publication for later changes.