
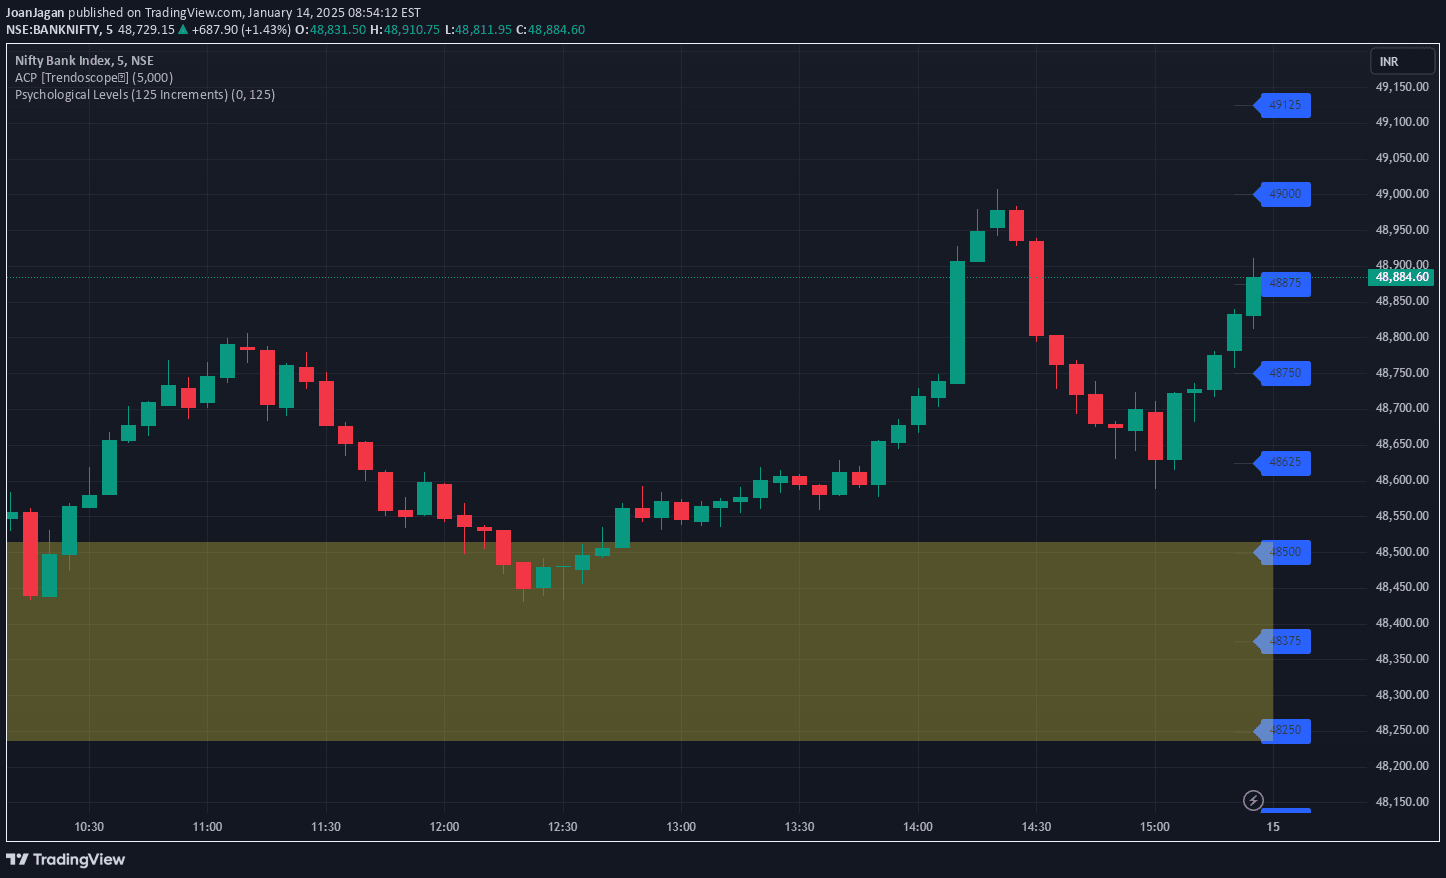
A dynamic technical analysis tool that identifies key psychological price levels to help traders recognize potential support, resistance, and market turning points across various financial instruments.
Explore complementary indicator rolesHow it works
The Psychological Levels Indicator calculates and plots horizontal lines at predetermined price intervals based on a customizable starting level and step size. Traders can set these parameters to match specific financial instruments, with a default setting of increments of 125 points from a base level.
The indicator dynamically adjusts these levels to the visible chart range, creating a series of horizontal lines that represent key psychological price points. Each line is labeled with its corresponding price, allowing traders to quickly identify potential zones of market interest and price action.
Why it may be useful
Psychological levels are crucial in trading because they represent points where large groups of traders tend to make decisions, potentially causing significant market movements. These levels reflect collective trader psychology and often coincide with key support, resistance, and potential trend reversal points.
By highlighting these important price zones, the indicator helps traders anticipate potential market behavior and make more informed trading decisions. Institutional traders frequently reference these levels, making them valuable reference points for understanding potential market dynamics and improving trading strategy.
When to explore it
The Psychological Levels Indicator is most effective in markets with clear trending or ranging behavior, where price tends to respect key psychological levels. It works particularly well in liquid markets like indices, stocks, forex, and cryptocurrencies where trader sentiment plays a significant role in price movement.
Traders can use this indicator for multiple purposes, including identifying potential entry and exit points, setting stop-loss levels, and understanding overall market sentiment. It is especially useful during periods of consolidation or when price is approaching significant round number levels that might trigger broader market reactions.
Keep exploring
What we’ve verified
Access, alerts and repainting behaviour have not been independently verified for this indicator. Check the creator’s current publication and settings.
General descriptions and classifications are recovered research. Verified details above identify the specific checks we have completed. Check the creator’s current publication for later changes.


