YOUR INDICATOR RESEARCH STARTS HERE

Find the right indicator.
Understand what it does.

Explore 11,183 indicators. Filter beyond the obvious.
Discover the tools that fit the way you trade.

THE INDICATOR LIBRARY

Results for “levelsandzones”

11,183 tools to explore

8 indicators matching your filters
Save search
VolumeSignalLevels

Liquidity Swings [LuxAlgo]

by LuxAlgo

A liquidity indicator that highlights swing areas with trading activity, tracking price revisits, accumulated volume, and potential support/resistance zones using customizable filtering.

Main price chart · unverifiedDay Trading · Swing Trading
Explore
17.9Klikes731.9Kviews131comments
Save
VolumeTrendEditor’s pick

Liquidity Levels [LuxAlgo]

by LuxAlgo

Peak Activity Levels indicator identifies support and resistance zones using volume peaks, displaying price levels where significant trading activity occurs and highlighting potential market turning points.

Main price chart · unverifiedDay Trading · Swing Trading
Explore
4.8Klikes280.7Kviews26comments
Save
LevelsSignalTrend

Peak & Valley Levels [AlgoAlpha]

by AlgoAlpha

A dynamic indicator that identifies key support and resistance levels by analyzing price action, candlestick patterns, and market movements to help traders spot potential reversal points.

Main price chart · unverifiedScalping · Day Trading
Explore
770likes22.3Kviews15comments
Save
SignalLevels

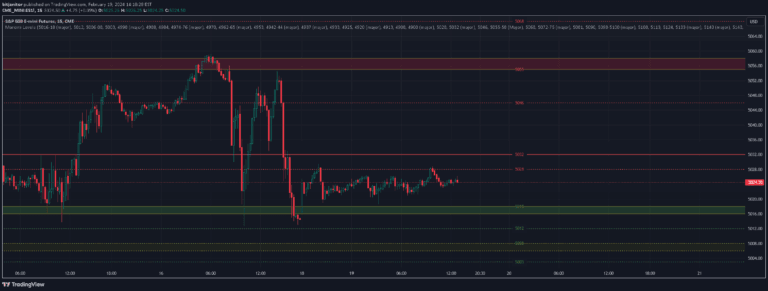
Mancini Levels

by bitjanitor

A level parsing indicator that allows traders to define custom support and resistance levels with optional major level designation. Helps identify key price zones for potential trading decisions.

Main price chart · unverifiedScalping · Day Trading
Explore
640likes10Kviews143comments
Save
TrendSignalLevels

CANDLE LEVELS [PRO]

by MYNAMEISBRANDON

A multi-timeframe indicator providing 55 price levels across different time frames, helping traders identify key support and resistance zones with customizable visualization.

Main price chart · unverifiedScalping · Day Trading
Explore
384likes10.2Kviews5comments
Save
LevelsTrend

Histogram-based price zones

by jhmnk89

A unique method for identifying support and resistance zones by analyzing the frequency of price extremes across recent trading periods, creating visual zones of potential price direction changes.

Main price chart · unverifiedScalping · Day Trading
Explore
212likes4.1Kviews2comments
Save

Likes, views, and comments are historical TradingView snapshots. They describe attention, not trading performance.

START WITH A QUESTION

A little less searching.
A lot more understanding.

Tell DeepAlpha what you need. Get an explanation, a shortlist,
and a direct path to the indicators behind it.

Ask DeepAlpha