
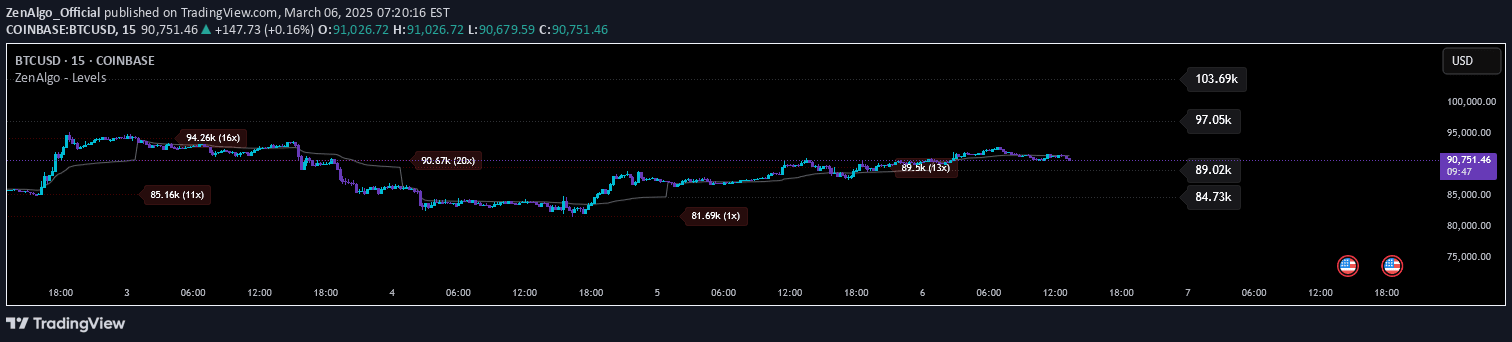
A multi-timeframe VWAP tool that automatically tracks and preserves historical volume-weighted average price lines, revealing key support and resistance zones across different market periods.
Explore complementary indicator rolesHow it works
The script creates multiple anchored Volume-Weighted Average Price (VWAP) lines by automatically detecting new time periods like sessions, weeks, or months. As each period completes, it locks in the VWAP line and stores it in an array, maintaining a historical record of volume-based price averages.
When new price bars form, the script tracks whether these bars intersect or test previous VWAP lines. It automatically flags tested lines in red, keeps a counter of how many times each line has been tested, and manages the display to prevent chart clutter by limiting the number and age of displayed historical VWAP lines.
Why it may be useful
By preserving multiple historical VWAP lines, traders gain a comprehensive view of volume-based fair value across different market periods. These lines reveal potential support and resistance zones where significant trading activity has occurred, helping traders understand market structure and volume dynamics more deeply.
The automated tracking and visualization of VWAP lines eliminates the manual work of setting up and managing multiple VWAP indicators. Traders can quickly identify recurring price interaction points, assess market sentiment, and gain insights into how volume has influenced price movements across various timeframes.
When to explore it
This VWAP tool is most effective in liquid markets with consistent volume data, particularly for traders seeking to understand multi-timeframe volume dynamics. It works best when analyzing assets with substantial trading volume, where VWAP lines can provide meaningful insights into market structure and potential turning points.
Traders can leverage this tool across different trading styles, from intraday scalping to longer-term swing trading. It is particularly useful when examining how price interacts with historical volume-weighted average prices, helping to identify potential entry and exit points based on volume-driven market behavior.
Keep exploring
What we’ve verified
Access, alerts and repainting behaviour have not been independently verified for this indicator. Check the creator’s current publication and settings.
General descriptions and classifications are recovered research. Verified details above identify the specific checks we have completed. Check the creator’s current publication for later changes.


