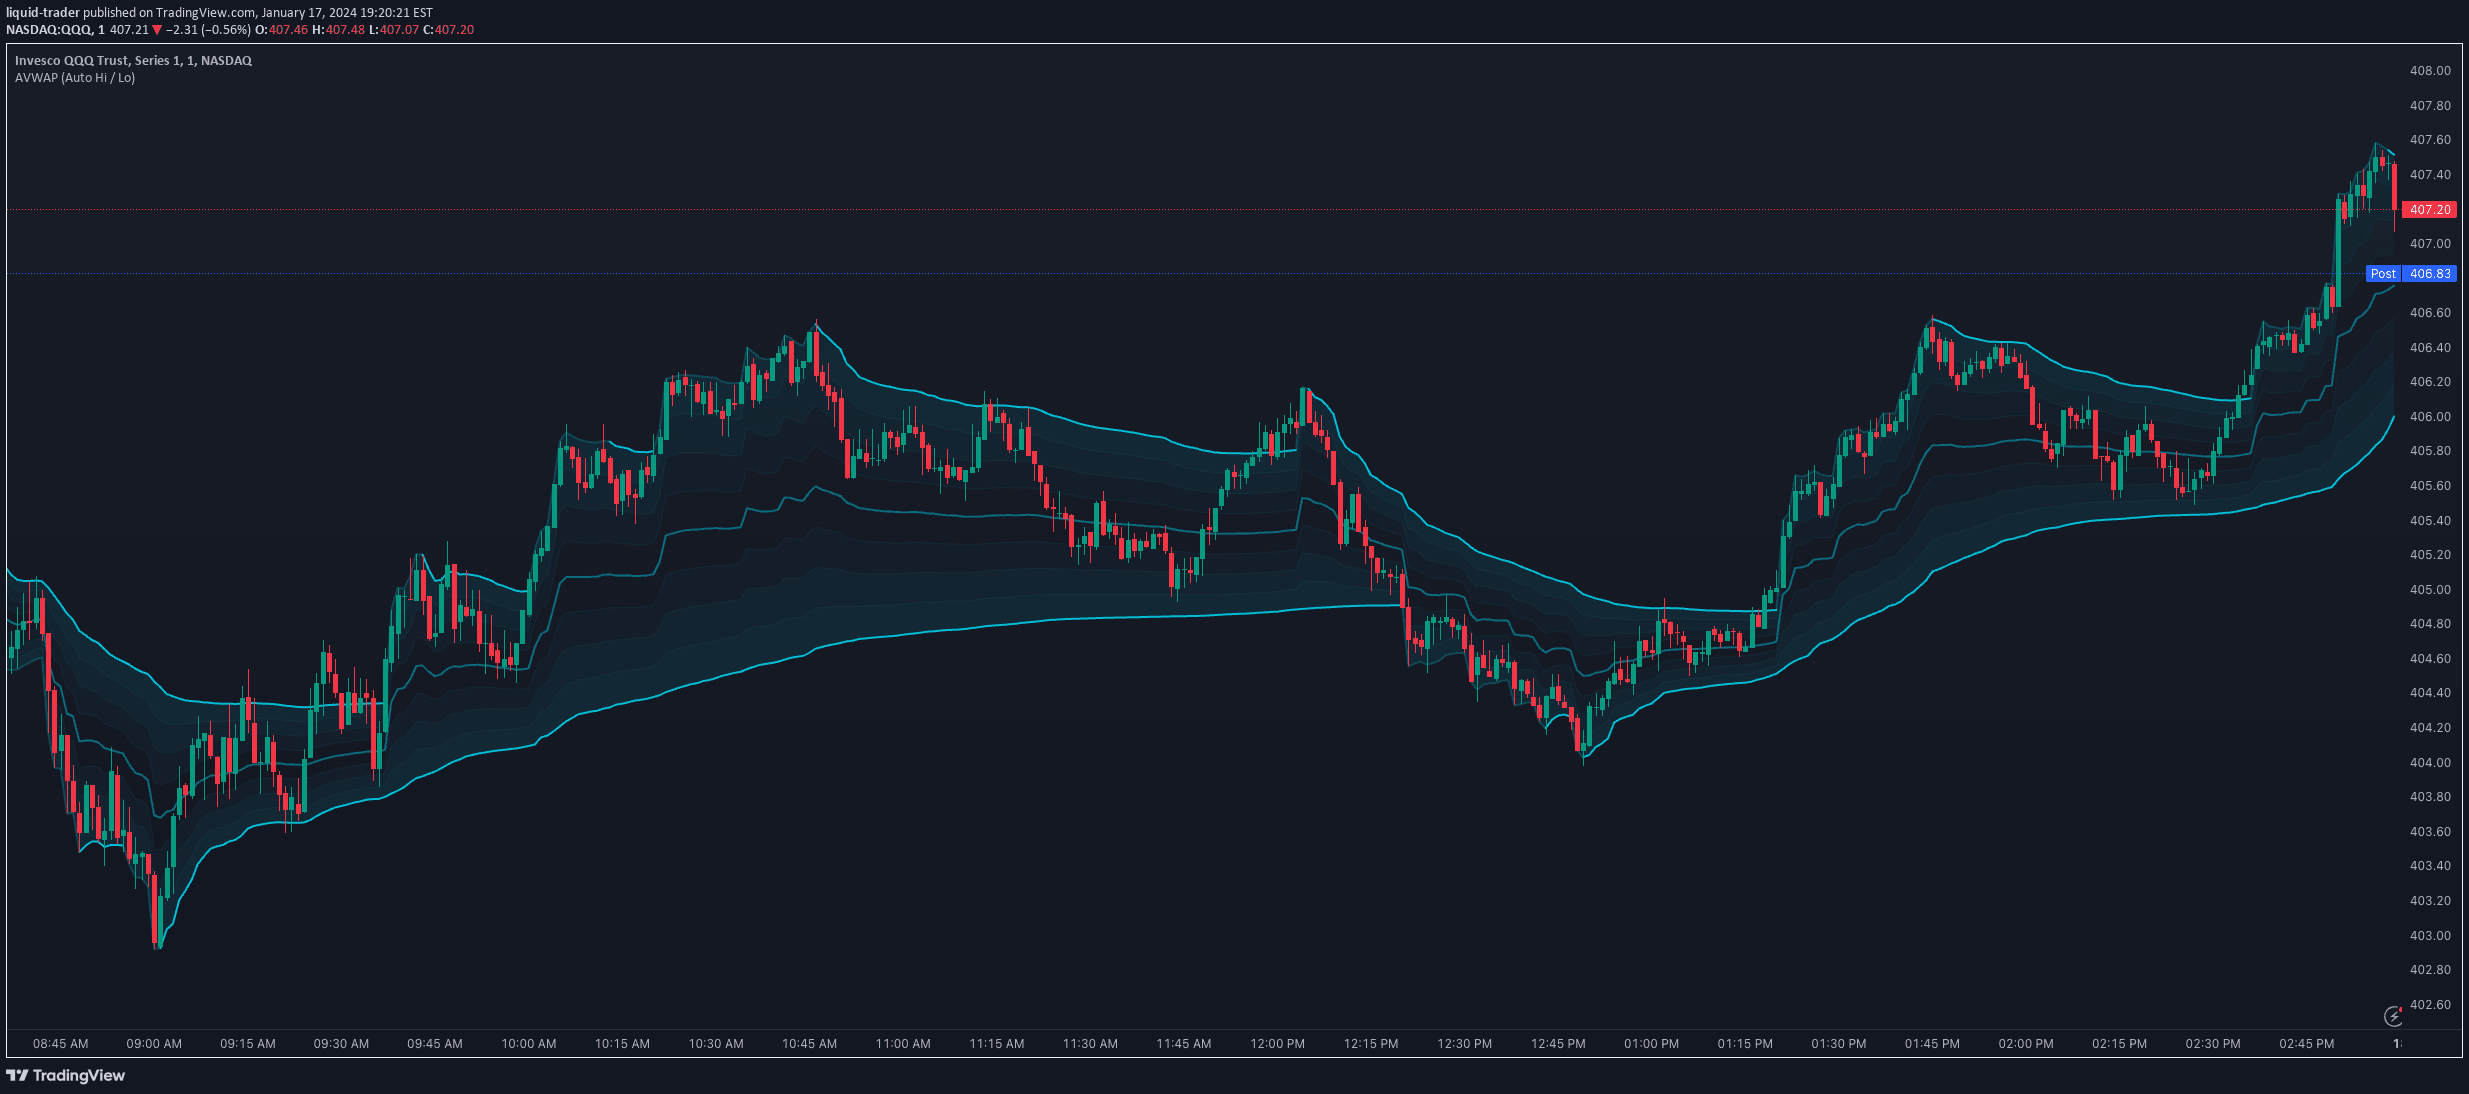
VWAP is a volume-weighted average price indicator that tracks price movement relative to volume, helping traders identify potential support and resistance levels.
Explore complementary indicator rolesHow it works
The VWAP indicator calculates the average price weighted by trading volume throughout a specific time period. It uses a cumulative calculation that multiplies price by volume and divides by total volume, creating a dynamic line that represents the true average price.
By automatically drawing VWAPs from the highest and lowest points of the last 'n' bars, this version provides traders with a flexible tool for analyzing price movement. The indicator uses arrays to compute values and plots the VWAP line directly on the chart's last historical bar.
Why it may be useful
VWAP provides traders with a more nuanced view of price movement by incorporating volume into the average price calculation. This approach offers a more accurate representation of true market sentiment compared to simple arithmetic averages that do not consider trading volume.
By revealing the real average price weighted by transaction volumes, VWAP helps traders understand where the most significant trading activity has occurred. This information can be crucial for making informed decisions about entry and exit points, as well as assessing the overall market dynamics.
When to explore it
VWAP is most effective in markets with significant trading volume and during periods of active price discovery. Traders often use it in intraday trading scenarios, particularly in highly liquid markets like stocks, futures, and forex, where volume data provides meaningful insights.
The indicator works best when combined with other technical analysis tools to confirm signals and validate potential trading strategies. Traders should pay special attention to how price interacts with the VWAP line, using it as a reference for potential support and resistance levels.
Keep exploring
What we’ve verified
Access, alerts and repainting behaviour have not been independently verified for this indicator. Check the creator’s current publication and settings.
General descriptions and classifications are recovered research. Verified details above identify the specific checks we have completed. Check the creator’s current publication for later changes.