ICT Killzones + Pivots [TFO]
A customizable trading indicator designed to identify ICT Killzones and track high and low price pivots during specific market sessions with configurable time windows.
Explore 11,183 indicators. Filter beyond the obvious.
Discover the tools that fit the way you trade.
11,183 tools to explore
A customizable trading indicator designed to identify ICT Killzones and track high and low price pivots during specific market sessions with configurable time windows.
A specialized indicator that identifies and visualizes order blocks with volumetric information, helping traders understand market order concentrations and potential price reversal zones.
A custom indicator using linear regression to analyze closing prices, helping traders identify market trends, mean reversion, and potential overbought or oversold conditions across different timeframes.
An advanced trading indicator that identifies potential Fair Value Gaps during specific one-hour market sessions and highlights support/resistance levels for strategic entry and exit points.
A dynamic indicator that identifies potential liquidity pools by tracking price interactions with specific zones, helping traders anticipate market movements and institutional trading strategies.
A footprint bar indicator that visualizes volume or open interest data within the chart's visible range, offering three different heatmap styles to analyze trading activity.
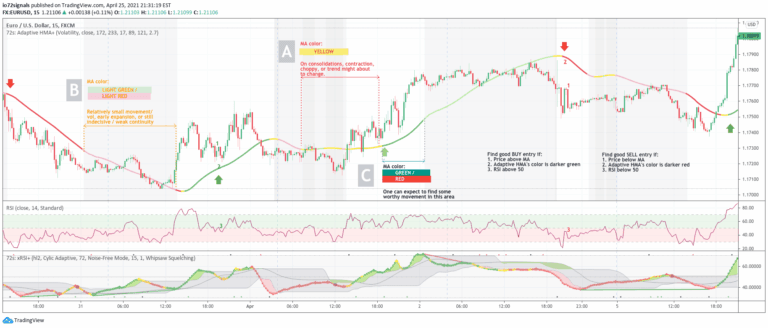
An adaptive Hull Moving Average that dynamically adjusts its period based on volume and volatility, providing clearer trend signals and market condition insights for traders.
A comprehensive hourly trading system that plots key price levels, identifies trend direction, and highlights potential entry and exit points across different timeframes.
A trading indicator that identifies the first fair value gap in a trading session, highlighting price imbalances and potential support/resistance zones with customized alerts.
A trading indicator that identifies swing failure patterns by detecting price movements that exceed and then retreat from key swing levels, potentially signaling trend reversals.
A volume profile indicator that reveals trading activity at price levels, highlighting key support and resistance zones through volume analysis and detecting market liquidity dynamics.
A trading signal that tracks volume swings by identifying increasing volume and higher highs/lower lows across multiple bars, revealing potential support and resistance levels.
Likes, views, and comments are historical TradingView snapshots. They describe attention, not trading performance.