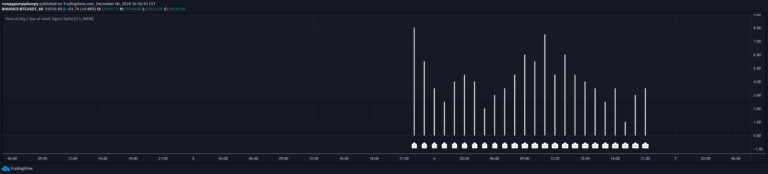
Intraday Volume Swings
A trading signal that tracks volume swings by identifying increasing volume and higher highs/lower lows across multiple bars, revealing potential support and resistance levels.
Explore 11,183 indicators. Filter beyond the obvious.
Discover the tools that fit the way you trade.
11,183 tools to explore
A trading signal that tracks volume swings by identifying increasing volume and higher highs/lower lows across multiple bars, revealing potential support and resistance levels.
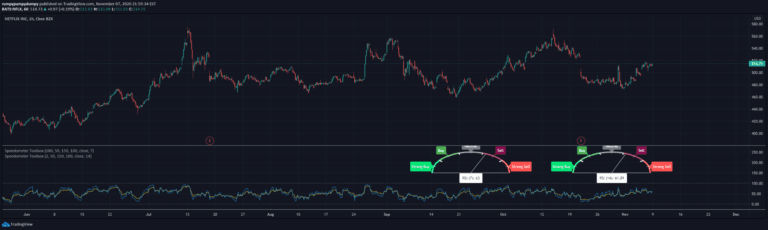
Custom metric speedometers provide specialized visualization techniques for tracking and representing performance indicators through graphical gauge-like representations.
Pivot points are unique pattern recognition techniques for identifying market structure through sequential high and low formations across different bar configurations and complexity levels.
A signal generator that creates range and equivalent levels across different timeframes, automatically removing duplicate levels and prioritizing higher timeframe information for clearer market perspectives.
An indicator approximating the intrabar point of control (POC) using time or volume data. It helps traders identify price points with the highest market participation across different time frames.
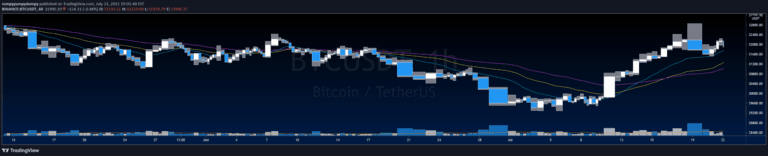
An addon for TradingView that displays volume bars alongside Equivolume bars, enhancing volume visualization and analysis for traders seeking comprehensive market insights.
Equivolume bars create charts where bar width dynamically represents trading volume, providing visual insights into market activity independent of traditional time scales.
An adaptive moving average indicator using Kaufmann's Efficiency Ratio and Ehler's MAMA/FAMA techniques to dynamically adjust calculation inputs based on market conditions.
An advanced market analysis technique measuring the Open Price Range (OPR) and filtering trades based on daily volatility, identifying potential trading opportunities early in the day.
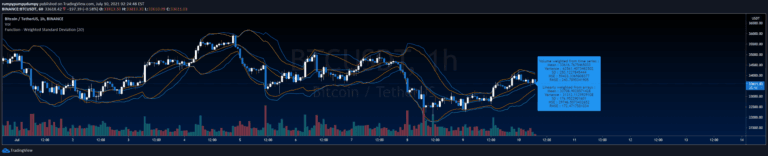
A statistical analysis function that calculates weighted mean, variance, standard deviation, and error metrics for time series data, helping traders understand data distribution and variability.
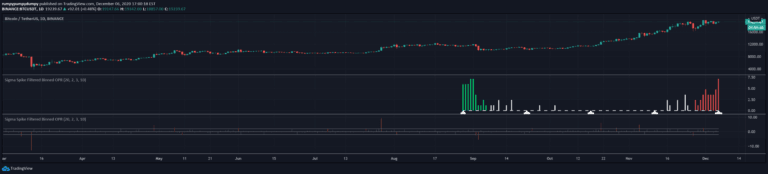
A trading signal that analyzes Sigma spikes by breaking down market volatility across different hours and days, providing detailed insights into trading patterns and market behavior.
An adaptive moving average technique using Ehler's Instantaneous Frequency Measurement to dynamically calculate optimal moving average length for more precise trend identification.
Likes, views, and comments are historical TradingView snapshots. They describe attention, not trading performance.