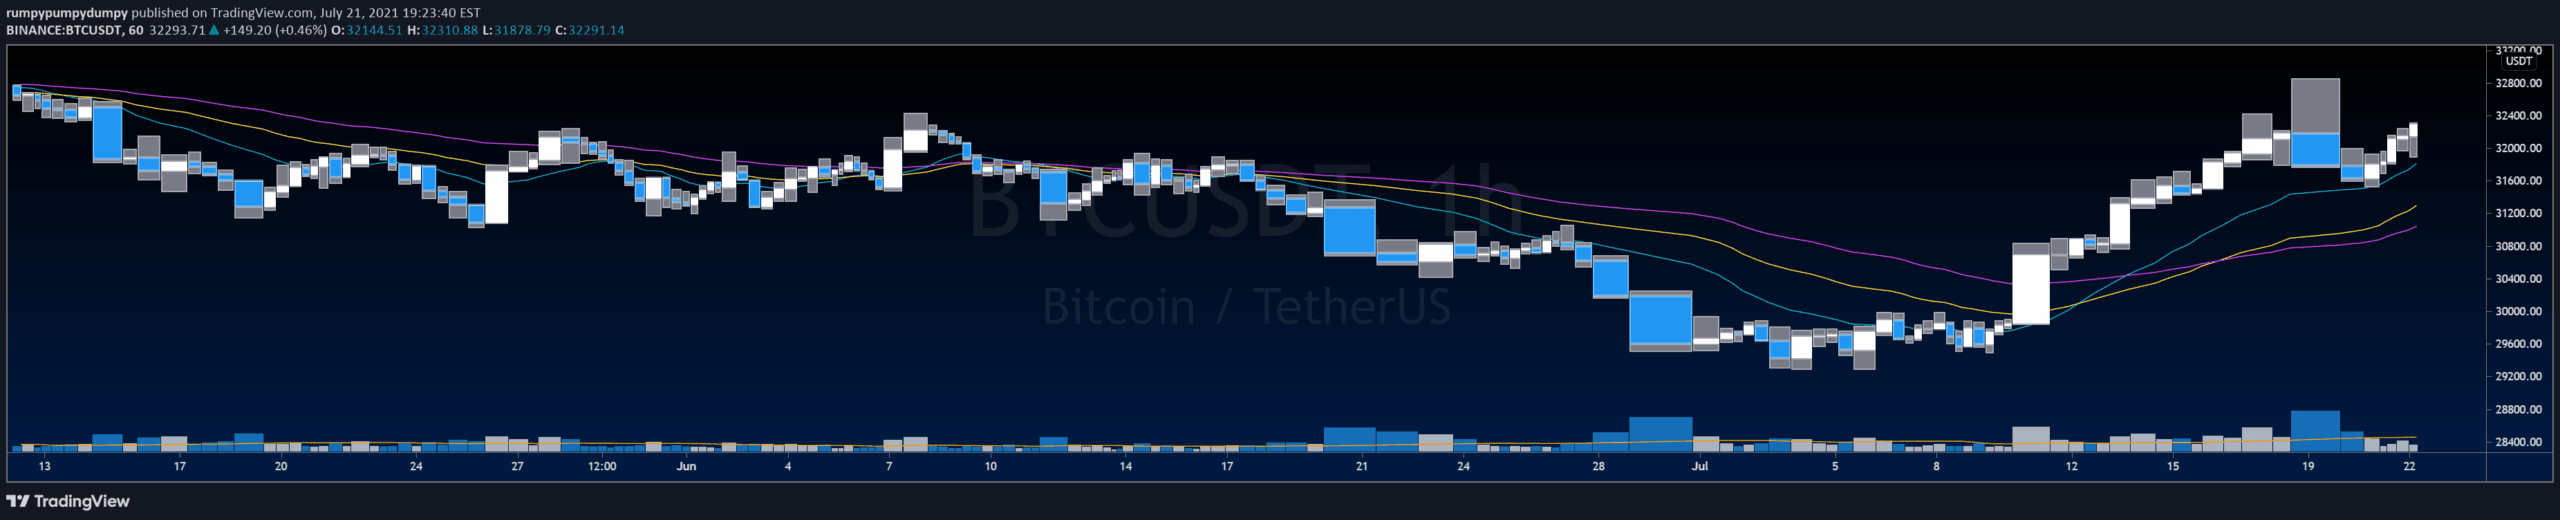
Equivolume bars create charts where bar width dynamically represents trading volume, providing visual insights into market activity independent of traditional time scales.
Explore complementary indicator rolesHow it works
Equivolume bars modify traditional candlestick charts by varying bar width proportionally to trading volume. Higher volume periods create wider bars, while lower volume periods result in narrower bars. Each bar maintains standard height representing price range.
The width dimension adds a volume perspective directly into price visualization. By integrating volume information into bar geometry, traders can quickly assess market participation and potential trend strength. This method provides an intuitive way to understand market dynamics beyond standard price-only representations
Why it may be useful
Equivolume bars offer traders a more comprehensive market view by incorporating volume directly into chart visualization. They help identify potential trend confirmations and market sentiment shifts more effectively than traditional charts. Wider bars indicate significant market interest and potential momentum, while narrow bars suggest lower trading activity.
This visual representation allows faster, more intuitive market analysis. Traders can quickly gauge market participation and potential trend reliability. The technique bridges price and volume information, providing a richer analytical perspective
When to explore it
Equivolume bars work best in liquid markets with consistent trading volumes. They are particularly effective for stocks, futures, and forex markets with high trading activity. Ideal for identifying trend strength and potential reversals during significant market events.
Most useful during periods of clear market direction or when seeking confirmation of price movements. Traders can leverage these bars during earnings reports, economic announcements, or sector-wide movements. Particularly valuable for day traders and swing traders monitoring short to medium-term market trends
Keep exploring
What we’ve verified
Access, alerts and repainting behaviour have not been independently verified for this indicator. Check the creator’s current publication and settings.
General descriptions and classifications are recovered research. Verified details above identify the specific checks we have completed. Check the creator’s current publication for later changes.