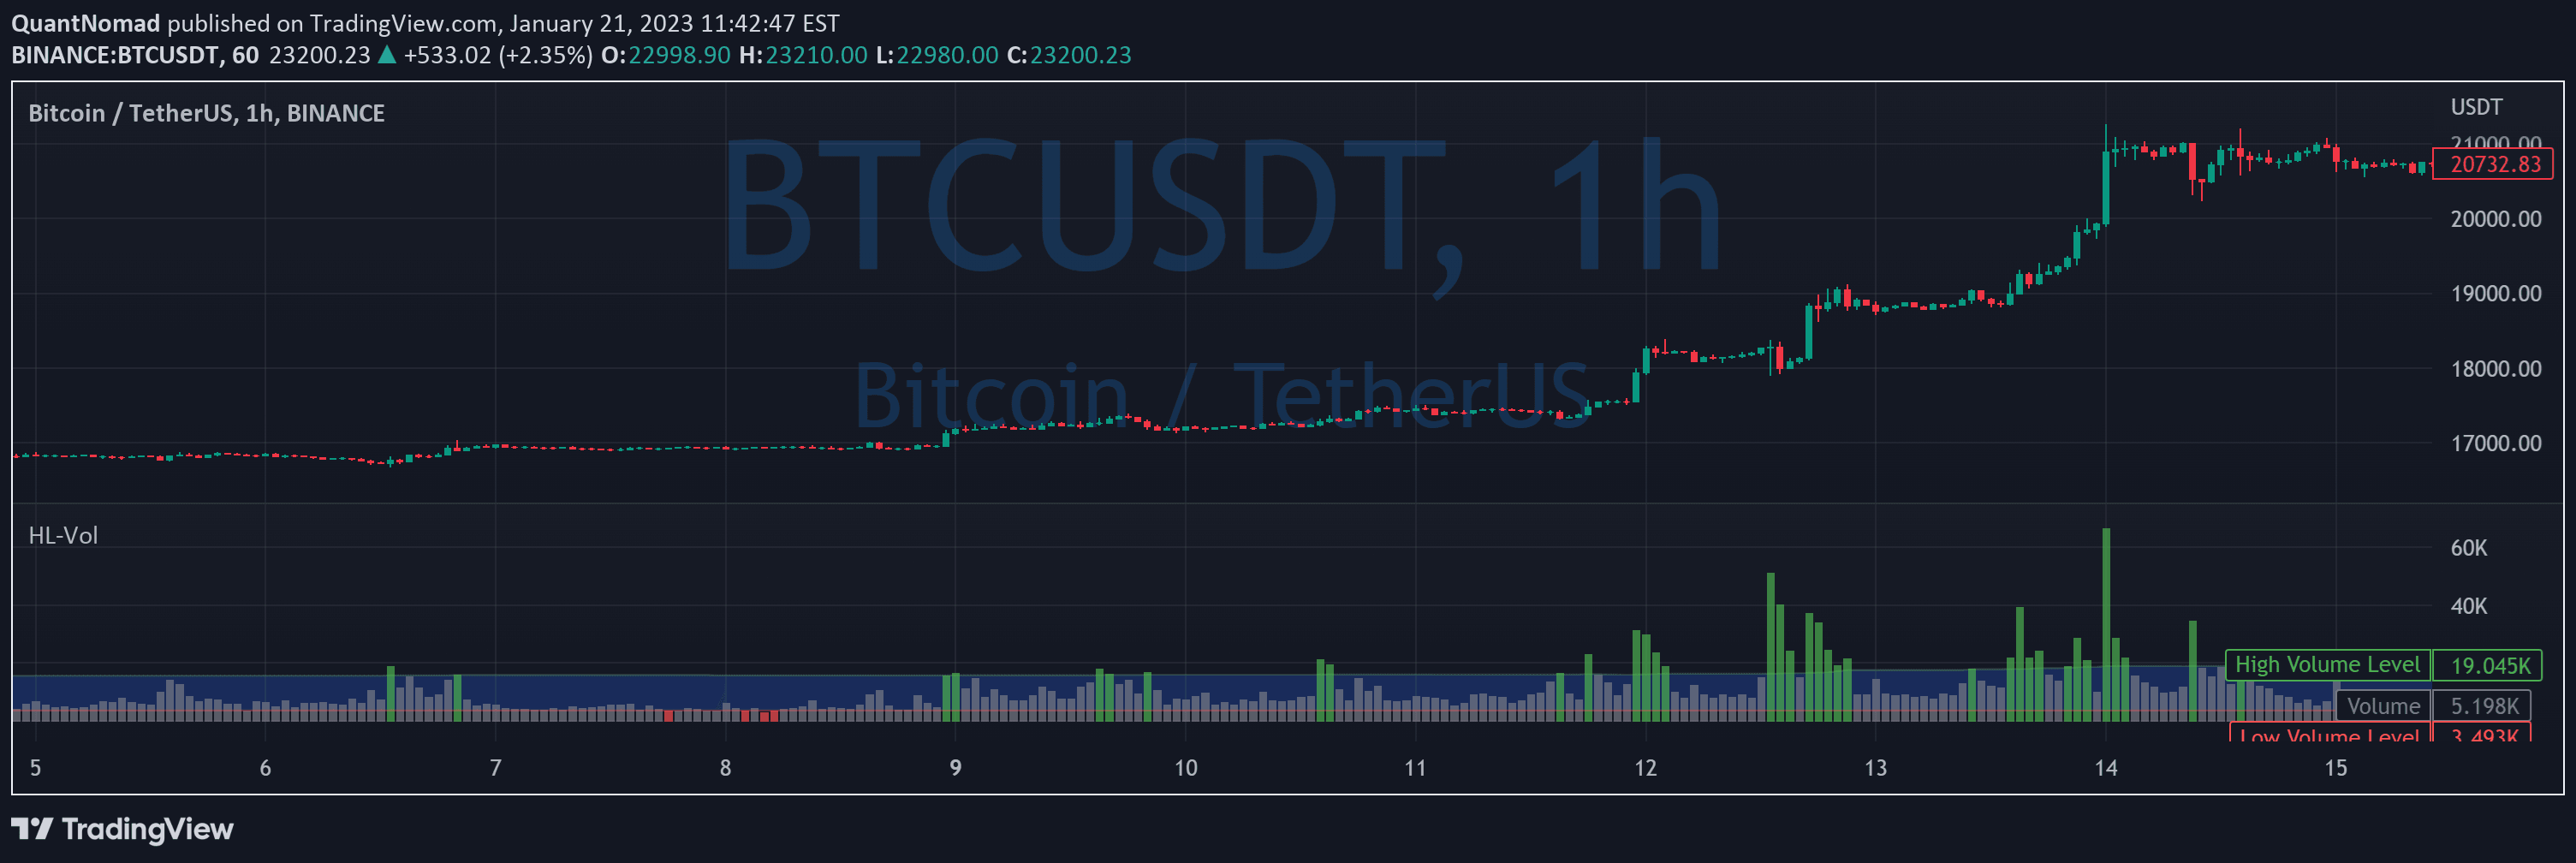
A trading indicator that identifies and highlights the highest volume bullish and bearish bars within a specified lookback period, providing visual cues for volume analysis and potential trend insights.
Explore complementary indicator rolesHow it works
The indicator scans a predefined number of previous bars to find the highest volume bullish and bearish bars. It identifies the bars with maximum volume in both upward and downward price movements during the specified lookback period.
Once the highest volume bars are determined, the indicator applies distinct colors (lime for bullish, fuchsia for bearish) to make these bars visually prominent. It also draws filled areas between the high and low points of these significant volume bars, creating clear visual markers that help traders quickly recognize important volume-based trading signals.
Why it may be useful
Volume is a critical aspect of technical analysis that provides insights into the strength and conviction behind price movements. By highlighting the highest volume bars, traders can better understand the underlying market dynamics and potential shifts in buying or selling pressure.
This indicator helps traders identify significant volume events that might signal potential trend reversals, breakouts, or confirmations of existing market movements. The visual representation makes it easier to interpret complex volume data, allowing traders to make more informed decisions based on volume-related market insights.
When to explore it
This indicator is most effective during periods of active trading with significant market volatility. It works best when used in conjunction with other technical analysis tools to confirm potential trading signals and validate market trends.
Traders should consider using this indicator during key market sessions, earnings announcements, economic releases, or when analyzing stocks or assets with typically high trading volumes. The customizable lookback period allows for flexibility in adapting the indicator to different trading styles and timeframes.
Keep exploring
What we’ve verified
Access, alerts and repainting behaviour have not been independently verified for this indicator. Check the creator’s current publication and settings.
General descriptions and classifications are recovered research. Verified details above identify the specific checks we have completed. Check the creator’s current publication for later changes.