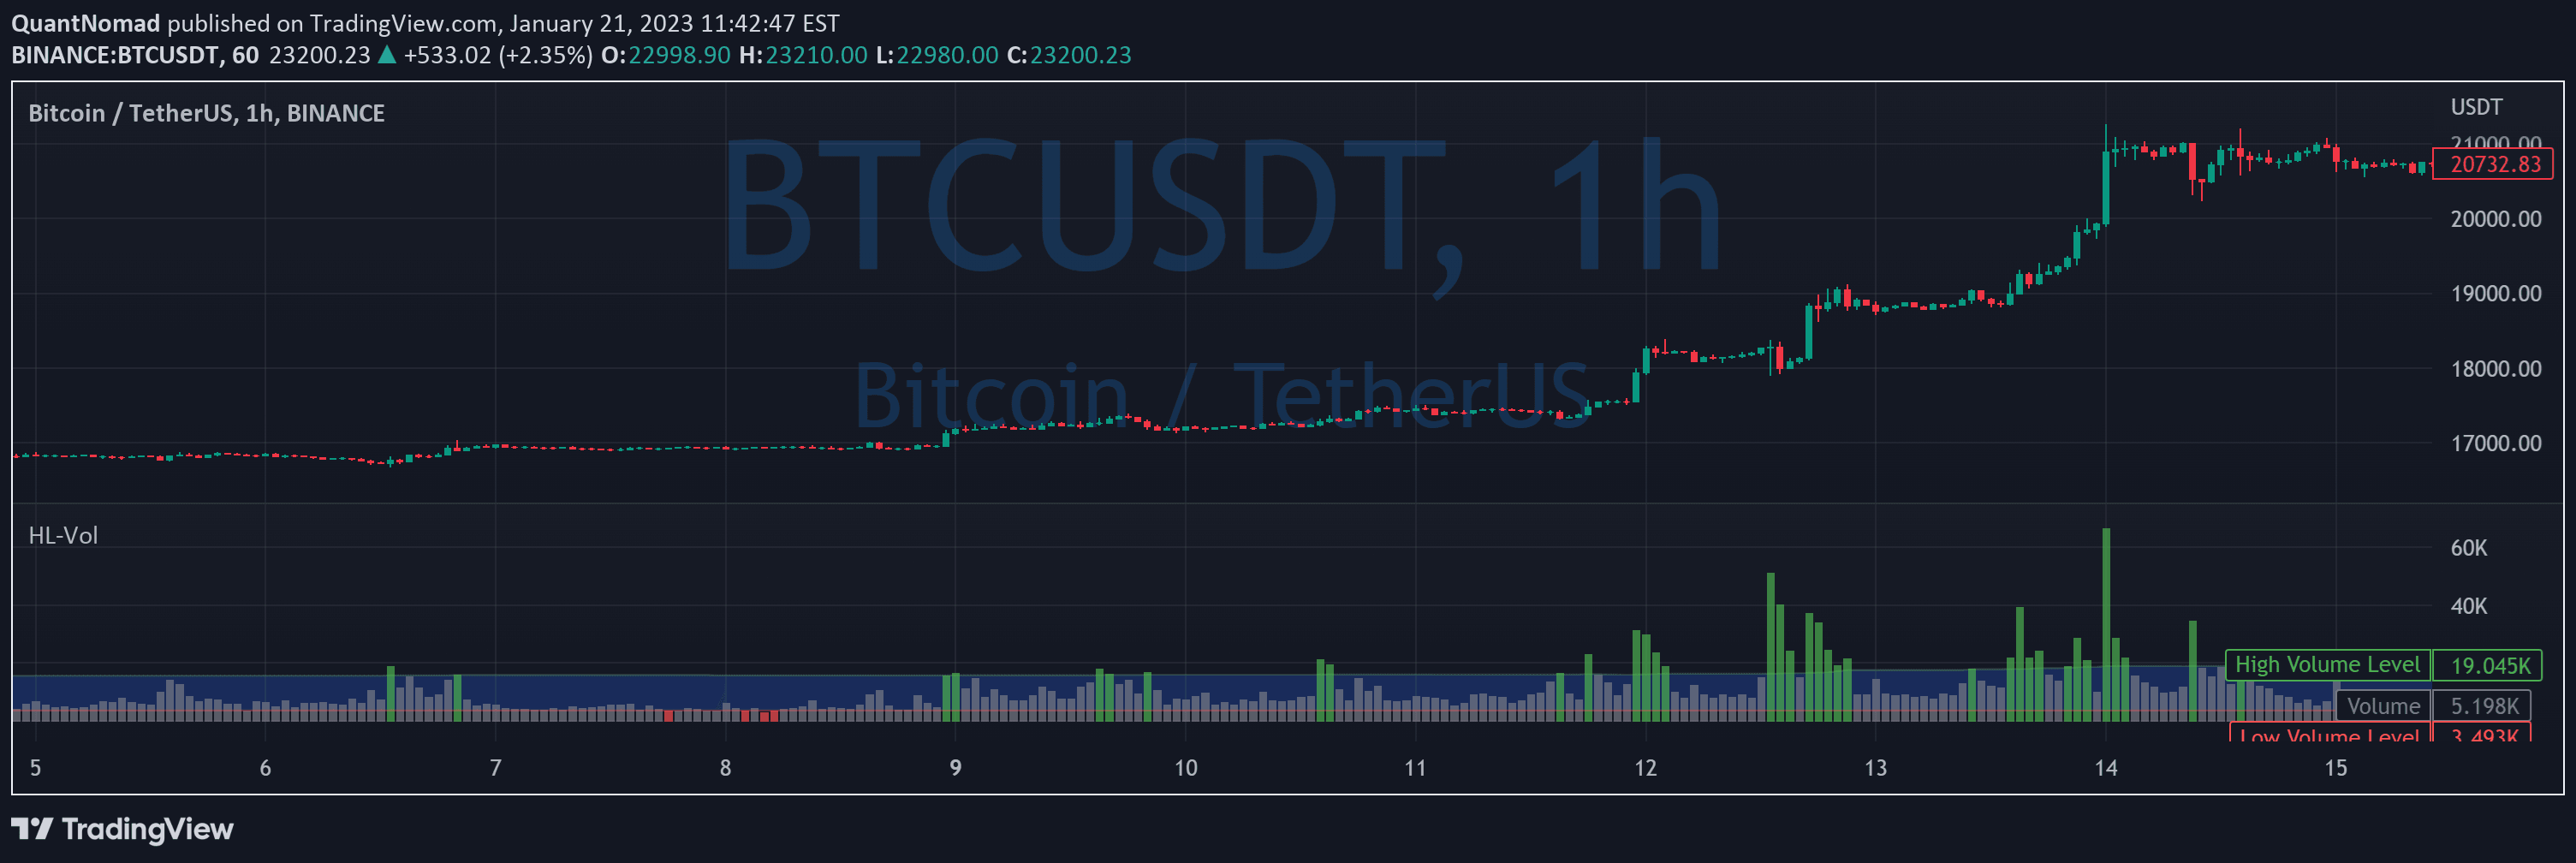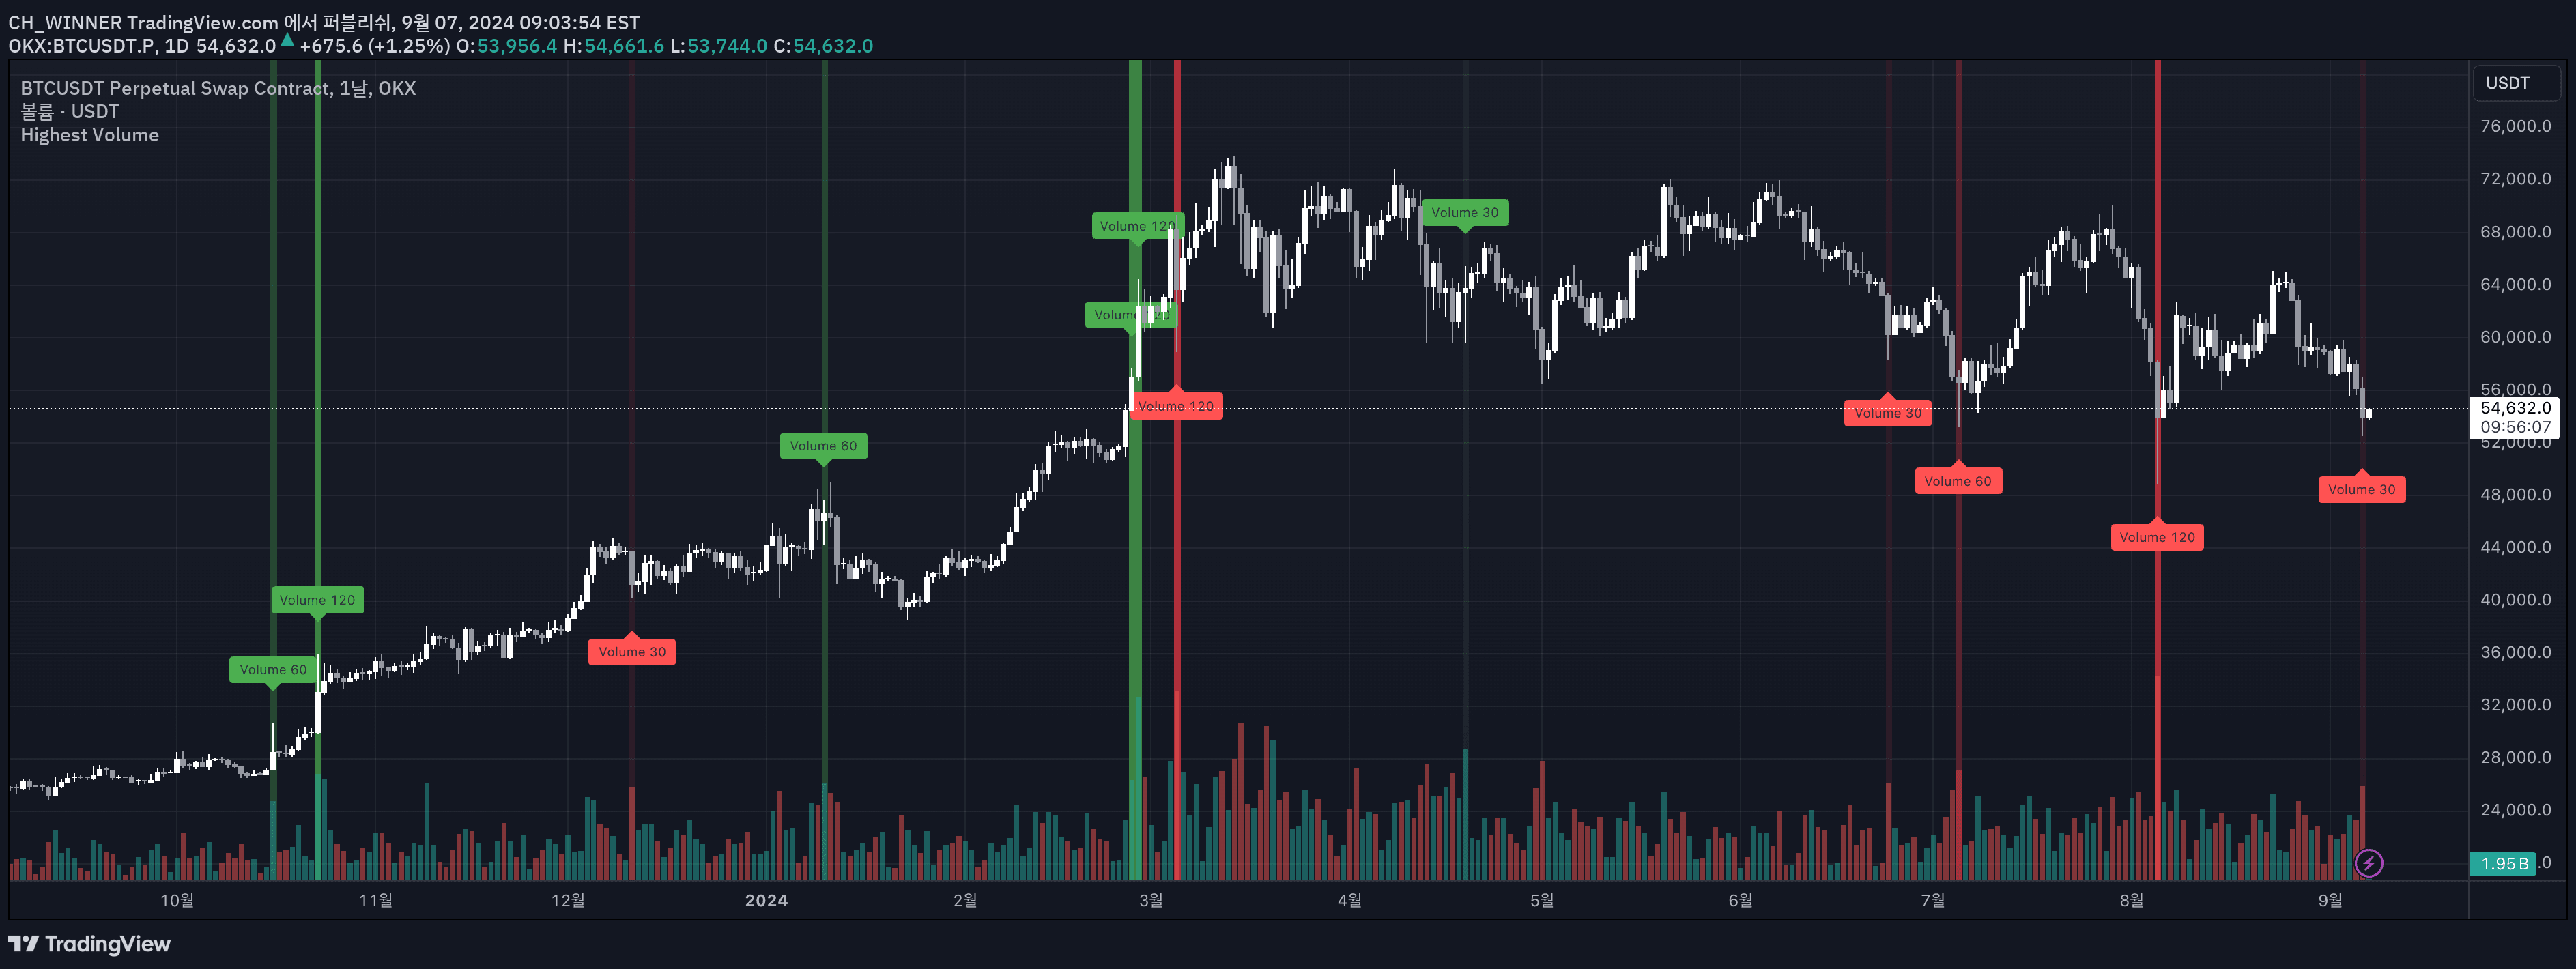
A volume-based indicator that tracks maximum trading volumes across 30, 60, 90, and 120 candle periods, visually highlighting significant volume patterns using color-coded backgrounds.
Explore complementary indicator rolesHow it works
The indicator systematically analyzes trading volume across four distinct time periods: 30, 60, 90, and 120 candles. It identifies the maximum volume within each of these periods and applies a unique color-coding system to visually represent the volume intensity.
The color progression ranges from red (30 candles) to orange (60 candles), yellow (90 candles), and green (120 candles), with darker colors indicating longer-term volume significance. When a new volume peak is detected, the indicator automatically highlights the corresponding candle with a specific background color. This helps traders quickly recognize volume spikes and understand their relative importance across different timeframes.
Why it may be useful
Volume is a critical indicator of market sentiment and potential price movements, providing traders with insight into the strength and conviction behind price changes. By tracking volume across multiple timeframes, this indicator offers a comprehensive view of trading activity that can help confirm trend strength, identify potential reversals, and gauge market momentum.
The color-coded visualization makes it easy for traders to quickly interpret complex volume data, reducing the cognitive load of manual analysis. This allows traders to make more informed decisions by understanding not just current volume, but how it compares to recent historical trading activity.
When to explore it
This volume indicator is most effective during periods of market volatility and significant price movements, where trading volume can provide crucial insights into market sentiment. It is particularly useful for traders looking to confirm trend strength, identify potential breakouts, or detect early signs of trend reversal through volume analysis.
Traders should pay special attention to sudden color changes or the emergence of high-volume candles, as these can signal important market turning points or the beginning of new trend cycles. The multi-timeframe approach makes it valuable for both short-term and intermediate trading strategies.
Keep exploring
What we’ve verified
Access, alerts and repainting behaviour have not been independently verified for this indicator. Check the creator’s current publication and settings.
General descriptions and classifications are recovered research. Verified details above identify the specific checks we have completed. Check the creator’s current publication for later changes.