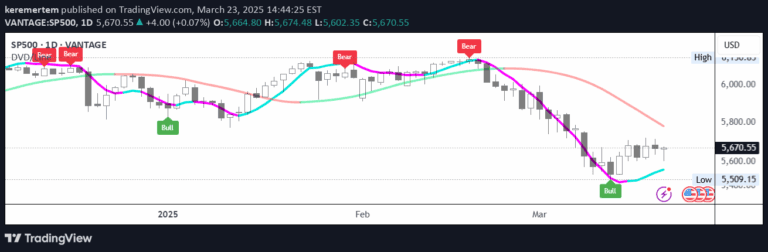
A scalping indicator that identifies volume breakouts and price movements to generate trading signals based on volume increase, price change, and market trend confirmation.
Explore complementary indicator rolesHow it works
The volume breakout signal operates by analyzing multiple market dynamics simultaneously. It first examines trading volume, checking if it has increased significantly by comparing current volume to the previous bar's volume using a predefined threshold.
The indicator then incorporates additional validation steps, including measuring price change percentage, calculating a Simple Moving Average (SMA) for trend confirmation, and assessing market volatility through Average True Range (ATR). Only when all specified conditions are met does the signal generate a bullish or bearish trading recommendation.
Why it may be useful
This signal provides traders with a structured approach to identifying potential trading opportunities during rapid market movements. By integrating volume, price change, and trend analysis, it offers a multi-dimensional perspective on market conditions that can help traders make more informed decisions.
The indicator's systematic approach reduces emotional trading by providing clear, objective criteria for entry and exit points. Its built-in cooldown mechanism also helps prevent over-trading, which is crucial for maintaining disciplined trading strategies.
When to explore it
The volume breakout signal is most effective in markets with consistent volume and moderate price fluctuations. It performs best in environments where price movements are predictable and not experiencing extreme volatility, making it particularly suitable for liquid markets like major forex pairs or actively traded stocks.
Traders should use this signal primarily for short-term trading strategies, particularly scalping and day trading. It is less effective in highly volatile or unpredictable market conditions, so users should always combine it with proper risk management techniques and comprehensive market analysis.
Keep exploring
What we’ve verified
Access, alerts and repainting behaviour have not been independently verified for this indicator. Check the creator’s current publication and settings.
General descriptions and classifications are recovered research. Verified details above identify the specific checks we have completed. Check the creator’s current publication for later changes.