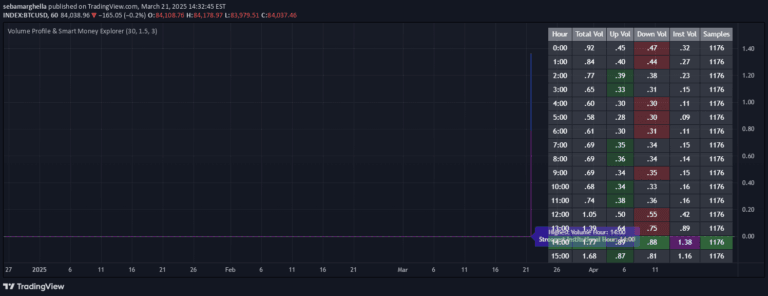
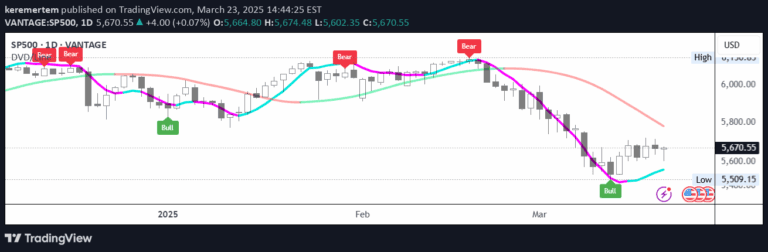
The Volume Dynamics Oscillator (VDO) analyzes volume trends by scaling and smoothing volume data to reveal market momentum and trading pressure.
Explore complementary indicator rolesHow it works
The Volume Dynamics Oscillator calculates volume flow by scaling raw volume data relative to its highest and lowest values over a specified period. It applies an exponential moving average (EMA) to smooth the scaled volume, reducing market noise and highlighting significant trends.
The oscillator dynamically shifts above or below a zero line, using gradient colors to indicate volume momentum. By applying different EMA periods and smoothing factors, traders can customize the indicator's sensitivity to capture subtle changes in volume dynamics.
Why it may be useful
The VDO provides traders with a sophisticated tool for understanding market sentiment beyond traditional volume indicators. By visualizing volume momentum through color-coded gradients and threshold markers, it offers clear insights into buying and selling pressure that can be challenging to interpret with raw volume data.
Unlike standard volume indicators, the VDO emphasizes relative volume strength and flow, making it particularly valuable for identifying potential trend reversals, confirming market movements, and spotting breakout opportunities with enhanced visual clarity.
When to explore it
The Volume Dynamics Oscillator is most effective during periods of significant market movement, such as trend initiations, potential reversals, and breakout scenarios. Traders can use it to confirm price action signals, assess the strength of current market trends, and identify potential shifts in trading momentum.
It performs exceptionally well when applied to liquid markets with consistent trading volume, such as major stock indices, forex pairs, and actively traded commodities. The indicator is particularly useful when combined with other technical analysis tools to validate trading decisions and improve overall strategy precision.
Keep exploring
What we’ve verified
Access, alerts and repainting behaviour have not been independently verified for this indicator. Check the creator’s current publication and settings.
General descriptions and classifications are recovered research. Verified details above identify the specific checks we have completed. Check the creator’s current publication for later changes.