An advanced market analysis technique measuring the Open Price Range (OPR) and filtering trades based on daily volatility, identifying potential trading opportunities early in the day.
Explore complementary indicator rolesHow it works
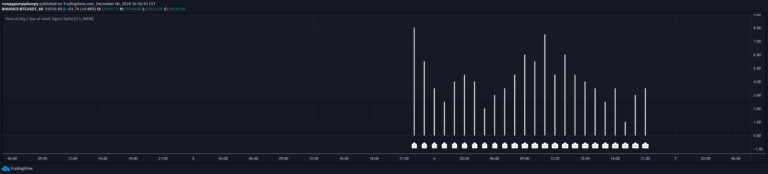
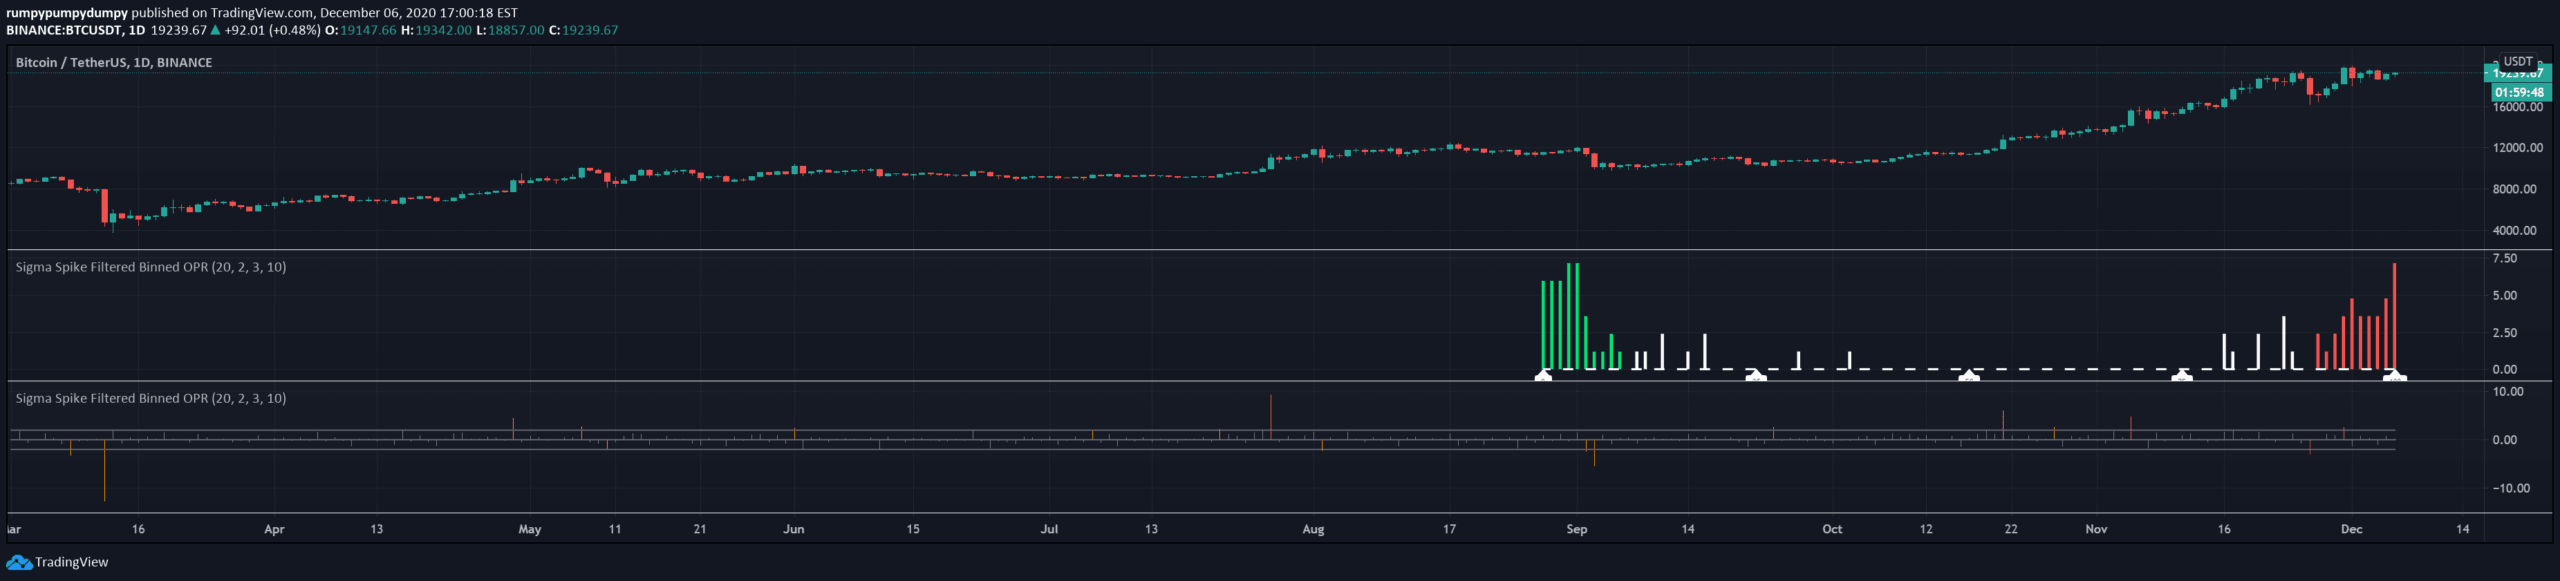
The Open Price Range (OPR) histogram tracks the distribution of opening prices relative to the day's total price range. By using Grime's Sigma Spike method, the indicator filters out days with lower volatility, focusing only on high-range trading days. It calculates where the opening price occurs within the day's range, creating a binned distribution of these values.
The histogram then highlights patterns where opens consistently cluster near the day's high or low extremes. This method requires identifying days with significant price movement and analyzing the statistical clustering of opening prices. The technique provides a visual representation of opening price behavior across multiple trading sessions
Why it may be useful
Understanding the OPR helps traders identify potential market momentum and directional bias early in the trading day. By analyzing where prices open relative to the full daily range, traders can gain insights into potential price movements and market sentiment. The method provides a statistical approach to understanding market behavior beyond traditional technical indicators.
It offers a nuanced view of price dynamics, helping traders make more informed decisions about entry and exit points. The volatility filtering ensures that the analysis focuses on meaningful trading days with significant price action. This approach can improve trade selection and timing strategies
When to explore it
The OPR analysis works best in markets with consistent daily volatility and clear price trends. It is most effective for day traders focusing on short-term price movements and looking to capitalize on early directional signals. Traders should apply this method in liquid markets with high trading volumes, such as major stock indices, forex pairs, and actively traded commodities.
The technique is particularly useful during periods of market uncertainty or potential trend reversals. Ideal for traders who want to understand market psychology and opening price behavior. Works well when combined with other technical and volume-based indicators for comprehensive market analysis
Keep exploring
What we’ve verified
Access, alerts and repainting behaviour have not been independently verified for this indicator. Check the creator’s current publication and settings.
General descriptions and classifications are recovered research. Verified details above identify the specific checks we have completed. Check the creator’s current publication for later changes.