YOUR INDICATOR RESEARCH STARTS HERE

Find the right indicator.
Understand what it does.

Explore 11,183 indicators. Filter beyond the obvious.
Discover the tools that fit the way you trade.

THE INDICATOR LIBRARY

Results for “experimental”

11,183 tools to explore

53 indicators matching your filters
Save search
TrendEditor’s pick

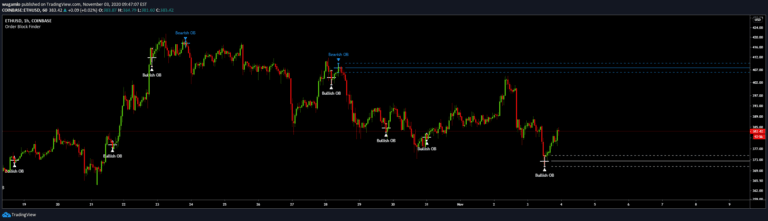
Order Block Finder (Experimental)

by wugamlo

An indicator identifying institutional order blocks by detecting significant price zones where potential trend reversals or continuations might occur based on sequential candle patterns.

Main price chart · unverifiedSwing Trading
Explore
22.1Klikes841.2Kviews406comments
Save
MomentumEditor’s pick

Logistic RSI, STOCH, ROC, AO, ... by DGT

by dgtrd

An experimental trading signal applying the Logistic Map Equation to popular indicators like Awesome Oscillator, ROC, RSI, and Stochastic to generate unique market insights through iterative mathematical calculations.

Separate pane · unverifiedSwing Trading
Explore
5.5Klikes140.8Kviews104comments
Save
MomentumEditor’s pick

Momentum Acceleration by DGT

by dgtrd

A momentum-based trading signal that measures price changes over time, using speed and acceleration principles to identify potential trend directions and trading setups.

Separate pane · unverifiedDay Trading · Swing Trading
Explore
5Klikes159.1Kviews131comments
Save
TrendMomentumEditor’s pick

Rolling largest Impulse Murreys Lines

by RicardoSantos

A trading signal using Kadane's algorithm to identify the largest market impulse within a window, then applying Murrey's math lines to map potential price movements and trading opportunities.

Main price chart · unverifiedDay Trading · Swing Trading
Explore
3.6Klikes84.5Kviews64comments
Save
TrendMomentumEditor’s pick

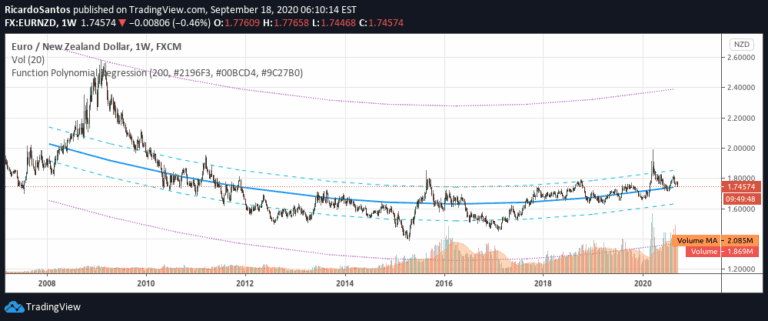
Function Polynomial Regression

by RicardoSantos

A polynomial regression function that analyzes data points to provide predictions, deviations, and statistical insights about trend and momentum patterns in financial datasets.

Main price chart · unverifiedDay Trading · Swing Trading
Explore
2.8Klikes40.5Kviews59comments
Save
TrendEditor’s pick

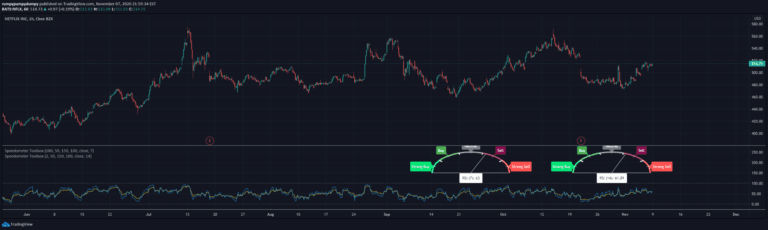
Speedometer Toolbox

by rumpypumpydumpy

Custom metric speedometers provide specialized visualization techniques for tracking and representing performance indicators through graphical gauge-like representations.

Main price chart · unverifiedSwing Trading
Explore
2.6Klikes40.1Kviews34comments
Save
TrendEditor’s pick

Moving Averages 3D

by LonesomeTheBlue

A Pine Script visualization technique that displays multiple moving averages in a 3D format using linefill.new(), allowing customizable MA types, lengths, and color schemes.

Main price chart · unverifiedDay Trading · Swing Trading
Explore
1.5Klikes53.3Kviews68comments
Save
SignalMomentumVolatility

Relative Andean Scalping

by serkany88

An experimental scalping overlay combining Andean Oscillator signals with a relative-bandwidth filter. It displays long and short markers and includes alerts.

Main price chartScalping
Explore
1.2Klikes27.6Kviews13comments
Save
TrendVolatilityEditor’s pick

[RS]Simple Forecast - Keltner Worms

by RicardoSantos

Keltner Worms is an experimental trading signal using Keltner Channels with an adaptive multiplier to generate dynamic forecast areas for price movement and trend identification.

Main price chart · unverifiedDay Trading · Swing Trading
Explore
877likes24.9Kviews10comments
Save

Likes, views, and comments are historical TradingView snapshots. They describe attention, not trading performance.

START WITH A QUESTION

A little less searching.
A lot more understanding.

Tell DeepAlpha what you need. Get an explanation, a shortlist,
and a direct path to the indicators behind it.

Ask DeepAlpha