RedK Trader Pressure Index (TPX v1.0)
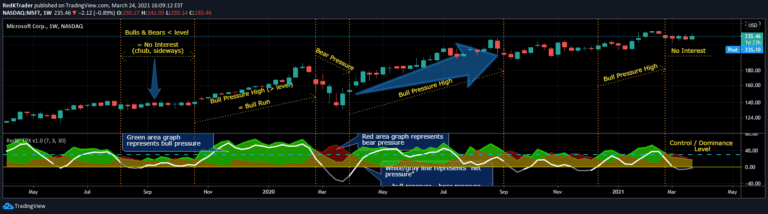
The RedK Trader Pressure Index (TPX) analyzes price bar changes to reveal the ongoing battle between bulls and bears, providing insights into market control and potential price action direction.
Explore 11,183 indicators. Filter beyond the obvious.
Discover the tools that fit the way you trade.
11,183 tools to explore
The RedK Trader Pressure Index (TPX) analyzes price bar changes to reveal the ongoing battle between bulls and bears, providing insights into market control and potential price action direction.
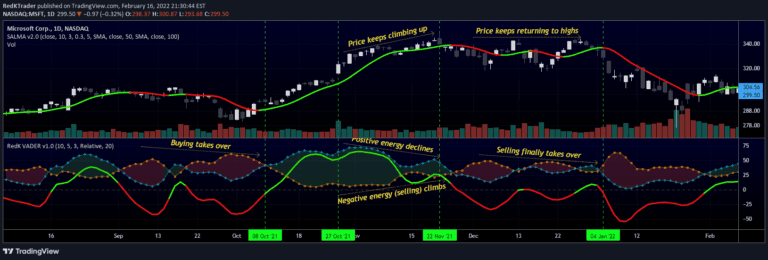
VADER is a volume-based technical indicator that measures market energy by analyzing price displacement and trading volume to determine bullish or bearish market sentiment.
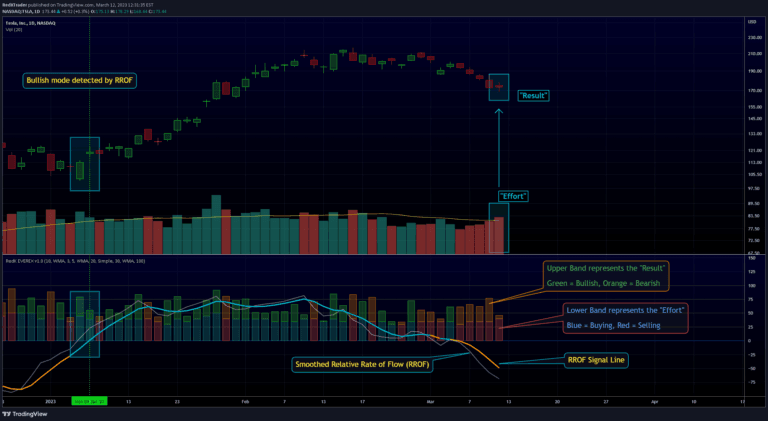
An experimental trading indicator that analyzes volume and price action using Volume Price Analysis and Wyckoff's Effort versus Result law to detect market strength and potential reversals.
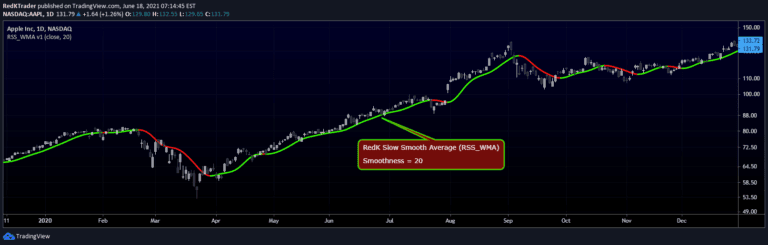
RedK Slow Smooth Average (RSS_WMA) is a specialized moving average designed to provide smooth trend visualization by filtering out short-term price noise through multiple weighted moving average passes.
Momentum Bars (Mo_Bars) is a three-moving average based indicator that visualizes relative momentum changes, helping traders identify potential trend shifts and momentum direction.
An advanced trading tool that uses an auto-stepping ladder to help identify trade entries and exits across different trading strategies like trend, momentum, and swing trading.
VolumeViewer is an advanced volume indicator that estimates supply and demand dynamics by analyzing price bar shapes, providing insights into market balance and potential key price levels.
A real-time portfolio tracking tool in TradingView that allows traders to monitor up to 10 holdings and cash position, providing visual insights into investment performance directly on the chart.
Compound Ratio Weighted Average (CoRa_Wave) is an advanced moving average that reduces lag by applying consistent logarithmic weights, offering high responsiveness to price movements.
A volume indicator estimating buy and sell volumes through price bar analysis, revealing market dynamics and potential supply/demand shifts without direct volume data.
An enhanced Directional Movement Index (DMI) that improves trend identification by offering unrestricted ADX visualization and more responsive calculations of directional movement.
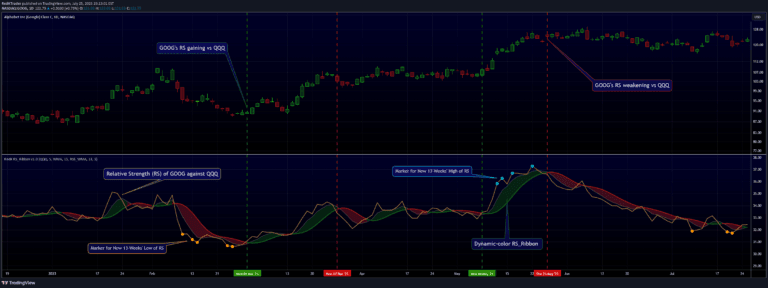
A technical analysis tool that compares a stock's performance against a benchmark index, revealing relative strength and potential market leadership through comprehensive RS calculation and visualization.
Likes, views, and comments are historical TradingView snapshots. They describe attention, not trading performance.