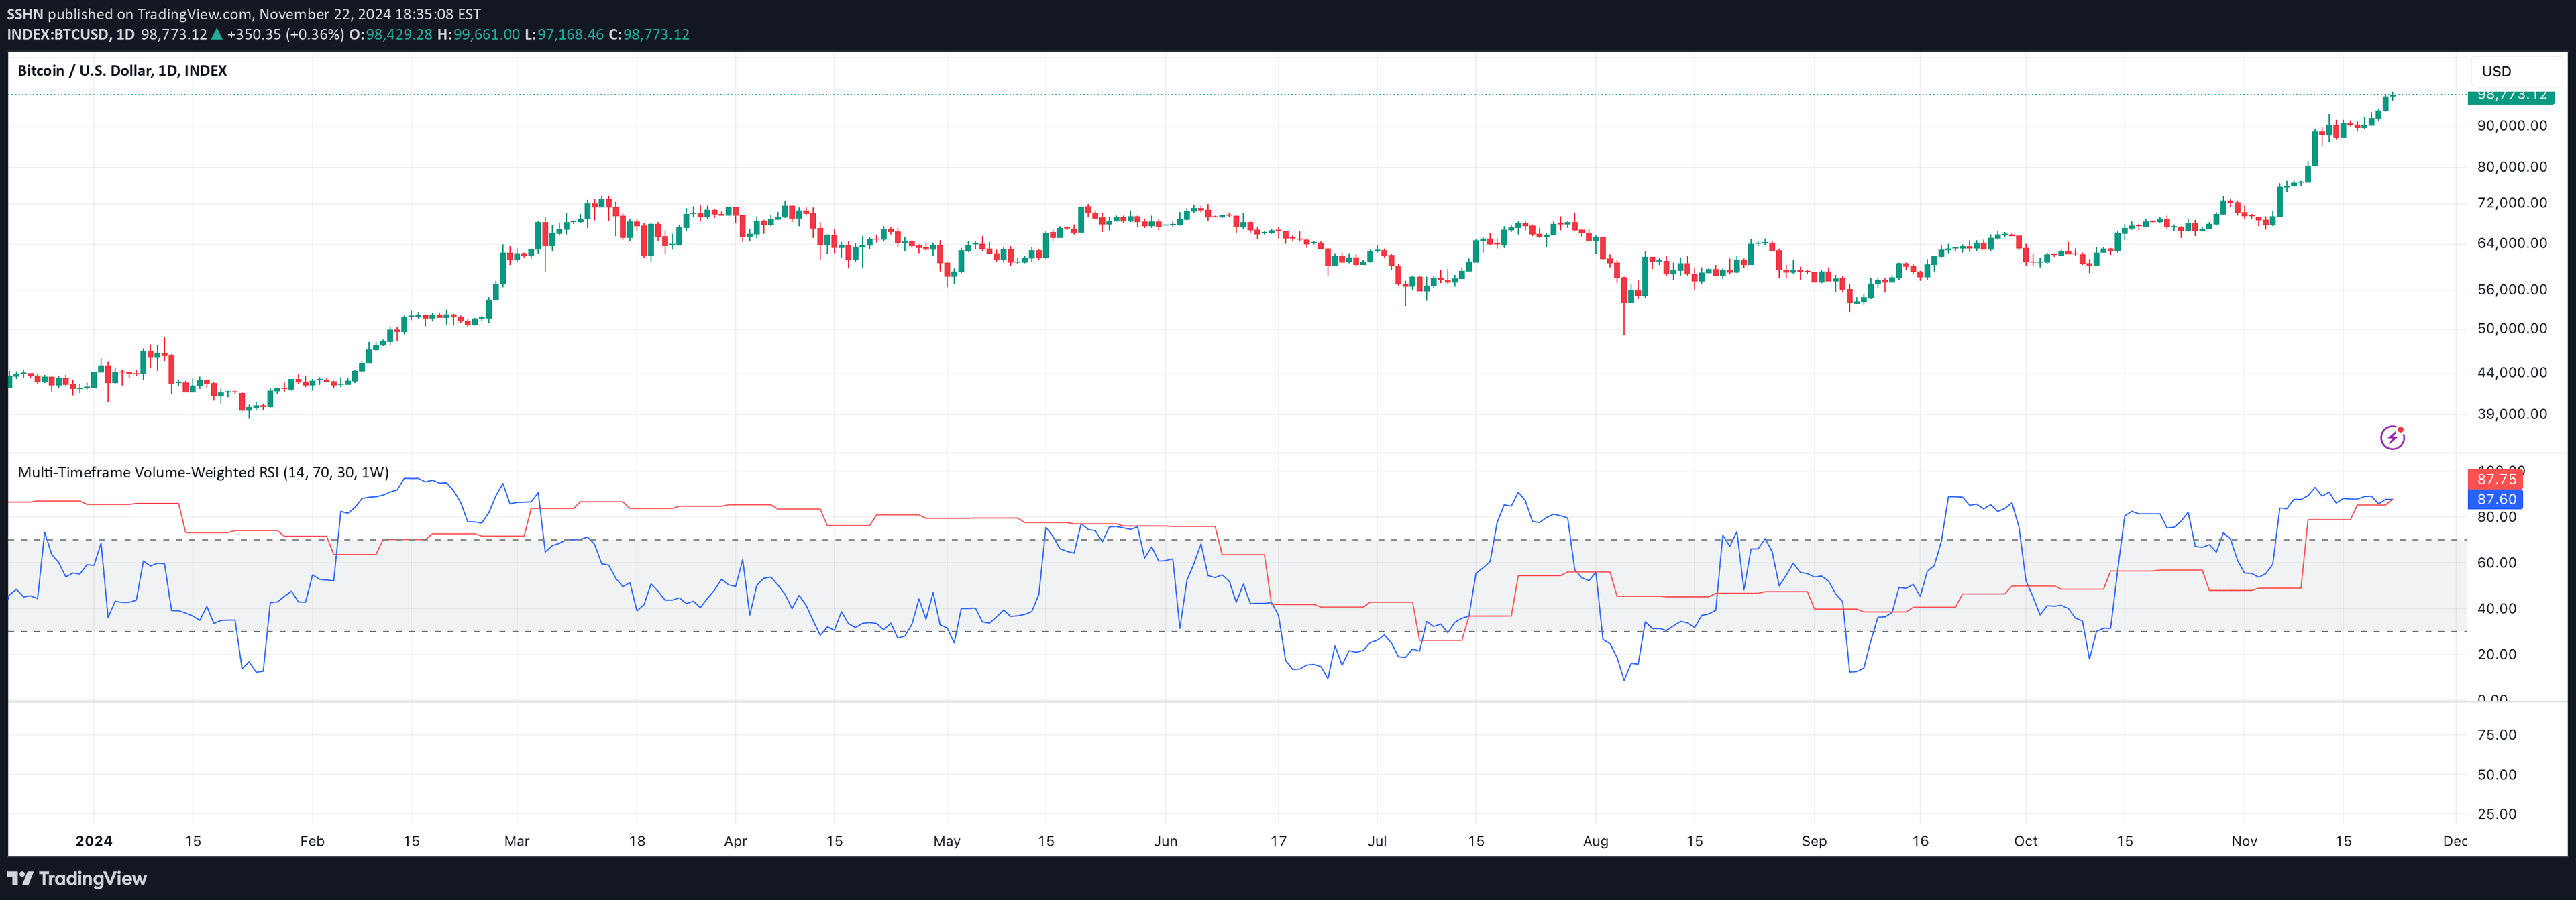
VADER is a volume-based technical indicator that measures market energy by analyzing price displacement and trading volume to determine bullish or bearish market sentiment.
Explore complementary indicator rolesHow it works
VADER calculates market energy by combining price moves and associated trading volume. It measures displacement (price change) and effort (volume) to create directional energy lines. The blue line represents positive buying energy, while the orange line shows negative selling energy.
When calculating energy, high displacement and high volume result in strong energy signals. The indicator uses different volume calculation modes: full volume, relative volume, or no volume, adapting to various trading instruments
Why it may be useful
VADER provides traders with deeper insights into market dynamics by revealing the underlying strength behind price movements. It helps traders understand whether price changes are supported by significant trading volume or are potentially weak and unsustainable.
By integrating both price action and volume, VADER offers a more comprehensive view of market sentiment. Traders can use this information to make more informed decisions about potential trend reversals or continuations
When to explore it
VADER works best when used alongside trend and momentum indicators like moving averages or MACD. It is particularly useful during periods of market uncertainty or potential trend changes.
The indicator is most effective in liquid markets with reliable volume data. Traders should pay special attention when the net energy line crosses the zero line, signaling a potential shift in market control between buyers and sellers
Keep exploring
What we’ve verified
Access, alerts and repainting behaviour have not been independently verified for this indicator. Check the creator’s current publication and settings.
General descriptions and classifications are recovered research. Verified details above identify the specific checks we have completed. Check the creator’s current publication for later changes.